Frozen novelties, ice type, pop, with low calorie sweetener vs. Fruit preserves — In-Depth Nutrition Comparison
Compare
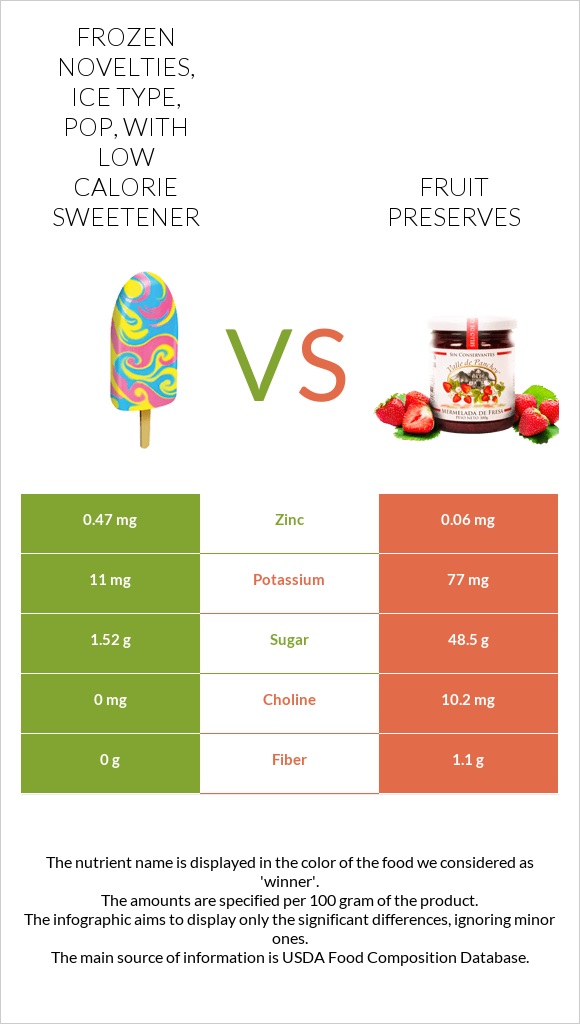
Differences between frozen novelties, ice type, pop, with low calorie sweetener and fruit preserves
- Frozen novelties, ice type, pop, with low calorie sweetener contains less copper and vitamin B2 than fruit preserves.
- Fruit preserves' daily need coverage for copper is 11% higher.
- Fruit preserves contain 8 times less zinc than frozen novelties, ice type, pop, with low calorie sweetener. Frozen novelties, ice type, pop, with low calorie sweetener contains 0.47mg of zinc, while fruit preserves contain 0.06mg.
- The amount of sugar in frozen novelties, ice type, pop, with low calorie sweetener is lower.
The food types used in this comparison are Frozen novelties, ice type, pop, with low calorie sweetener and Jams and preserves.
Infographic
Infographic link
Mineral Comparison
Mineral comparison score is based on the number of minerals by which one or the other food is richer. The "coverage" charts below show how much of the daily needs can be covered by 300 grams of the food.
| Contains more IronIron | +36.7% |
| Contains more ZincZinc | +683.3% |
| Contains less SodiumSodium | -68.8% |
| Contains more MagnesiumMagnesium | +300% |
| Contains more CalciumCalcium | +∞% |
| Contains more PotassiumPotassium | +600% |
| Contains more CopperCopper | +∞% |
| Contains more PhosphorusPhosphorus | +∞% |
| Contains more ManganeseManganese | +∞% |
| Contains more SeleniumSelenium | +∞% |
Vitamin Comparison
Vitamin comparison score is based on the number of vitamins by which one or the other food is richer. The "coverage" charts below show how much of the daily needs can be covered by 300 grams of the food.
| Contains more Vitamin CVitamin C | +18.2% |
| Contains more Vitamin EVitamin E | +∞% |
| Contains more Vitamin B1Vitamin B1 | +∞% |
| Contains more Vitamin B2Vitamin B2 | +∞% |
| Contains more Vitamin B3Vitamin B3 | +∞% |
| Contains more Vitamin B5Vitamin B5 | +∞% |
| Contains more Vitamin B6Vitamin B6 | +∞% |
| Contains more FolateFolate | +∞% |
All nutrients comparison - raw data values
| Nutrient |  |
 |
DV% diff. |
| Carbs | 5.92g | 68.86g | 21% |
| Calories | 24kcal | 278kcal | 13% |
| Copper | 0mg | 0.1mg | 11% |
| Vitamin B2 | 0mg | 0.076mg | 6% |
| Fiber | 0g | 1.1g | 4% |
| Zinc | 0.47mg | 0.06mg | 4% |
| Selenium | 0µg | 2µg | 4% |
| Phosphorus | 0mg | 19mg | 3% |
| Folate | 0µg | 11µg | 3% |
| Vitamin C | 10.4mg | 8.8mg | 2% |
| Calcium | 0mg | 20mg | 2% |
| Potassium | 11mg | 77mg | 2% |
| Iron | 0.67mg | 0.49mg | 2% |
| Manganese | 0mg | 0.04mg | 2% |
| Vitamin B6 | 0mg | 0.02mg | 2% |
| Choline | 0mg | 10.2mg | 2% |
| Protein | 0g | 0.37g | 1% |
| Magnesium | 1mg | 4mg | 1% |
| Sodium | 10mg | 32mg | 1% |
| Vitamin E | 0mg | 0.12mg | 1% |
| Vitamin B1 | 0mg | 0.016mg | 1% |
| Weight per 100 calories | 417g | 36g | N/A |
| Fats | 0g | 0.07g | 0% |
| Net carbs | 5.92g | 67.76g | N/A |
| Sugar | 1.52g | 48.5g | N/A |
| Vitamin B3 | 0mg | 0.036mg | 0% |
| Vitamin B5 | 0mg | 0.02mg | 0% |
| Saturated fat | 0g | 0.01g | 0% |
| Monounsaturated fat | 0g | 0.038g | 0% |
| Tryptophan | 0.008mg | 0% | |
| Threonine | 0.023mg | 0% | |
| Isoleucine | 0.017mg | 0% | |
| Leucine | 0.037mg | 0% | |
| Lysine | 0.03mg | 0% | |
| Methionine | 0.001mg | 0% | |
| Phenylalanine | 0.021mg | 0% | |
| Valine | 0.021mg | 0% | |
| Histidine | 0.014mg | 0% | |
| Fructose | 0.34g | 0% |
Macronutrient Comparison
Macronutrient breakdown side-by-side comparison
Protein:
0 g
Fats:
0 g
Carbs:
5.92 g
Water:
94.03 g
Other:
0.05 g
Protein:
0.37 g
Fats:
0.07 g
Carbs:
68.86 g
Water:
30.47 g
Other:
0.23 g
| Contains more WaterWater | +208.6% |
| Contains more ProteinProtein | +∞% |
| Contains more FatsFats | +∞% |
| Contains more CarbsCarbs | +1063.2% |
| Contains more OtherOther | +360% |