The main differences between ham and mung beans Ham has more vitamin B12; however, mung beans have more folate, copper, iron, fiber, manganese, magnesium, vitamin B5, and potassium. Daily need coverage for folate for mung beans is 156% higher. Mung beans are lower in sodium. Mung beans have a higher glycemic index than ham. Food types used in this article are Pork, cured, ham, boneless, extra lean (approximately 5% fat), roasted and Mung beans, mature seeds, raw .
Infographic
Mineral Comparison
Mineral comparison score is based on the number of minerals by which one or the other food is richer. The "coverage" charts below show how much of the daily needs can be covered by 300 grams of the food.
1
100 g
300 g
3 oz - 85g 1 cup - 140g
Magnesium
Magnesium
Calcium
Calcium
Potassium
Potassium
Iron
Iron
Copper
Copper
Zinc
Zinc
Phosphorus
Phosphorus
Sodium
Sodium
Manganese
Manganese
Selenium
Selenium
10%
2.4%
25%
56%
26%
79%
84%
157%
7%
106%
8
100 g
300 g
1 tbsp - 13g 1 cup - 207g
Magnesium
Magnesium
Calcium
Calcium
Potassium
Potassium
Iron
Iron
Copper
Copper
Zinc
Zinc
Phosphorus
Phosphorus
Sodium
Sodium
Manganese
Manganese
Selenium
Selenium
135%
40%
110%
253%
314%
73%
157%
2%
135%
45%
Vitamin Comparison
Vitamin comparison score is based on the number of vitamins by which one or the other food is richer. The "coverage" charts below show how much of the daily needs can be covered by 300 grams of the food.
4
100 g
300 g
3 oz - 85g 1 cup - 140g
Vitamin C
Vit. C
Vitamin D
Vit. D
Vitamin A
Vit. A
Vitamin E
Vit. E
Vitamin B1
Vit. B1
Vitamin B2
Vit. B2
Vitamin B3
Vit. B3
Vitamin B5
Vit. B5
Vitamin B6
Vit. B6
Vitamin B12
Vit. B12
Vitamin K
Vit. K
Folate
Folate
0%
12%
0%
5%
189%
47%
75%
24%
92%
81%
0%
2.3%
7
100 g
300 g
1 tbsp - 13g 1 cup - 207g
Vitamin C
Vit. C
Vitamin D
Vit. D
Vitamin A
Vit. A
Vitamin E
Vit. E
Vitamin B1
Vit. B1
Vitamin B2
Vit. B2
Vitamin B3
Vit. B3
Vitamin B5
Vit. B5
Vitamin B6
Vit. B6
Vitamin B12
Vit. B12
Vitamin K
Vit. K
Folate
Folate
16%
0%
2%
10%
155%
54%
42%
115%
88%
0%
23%
469%
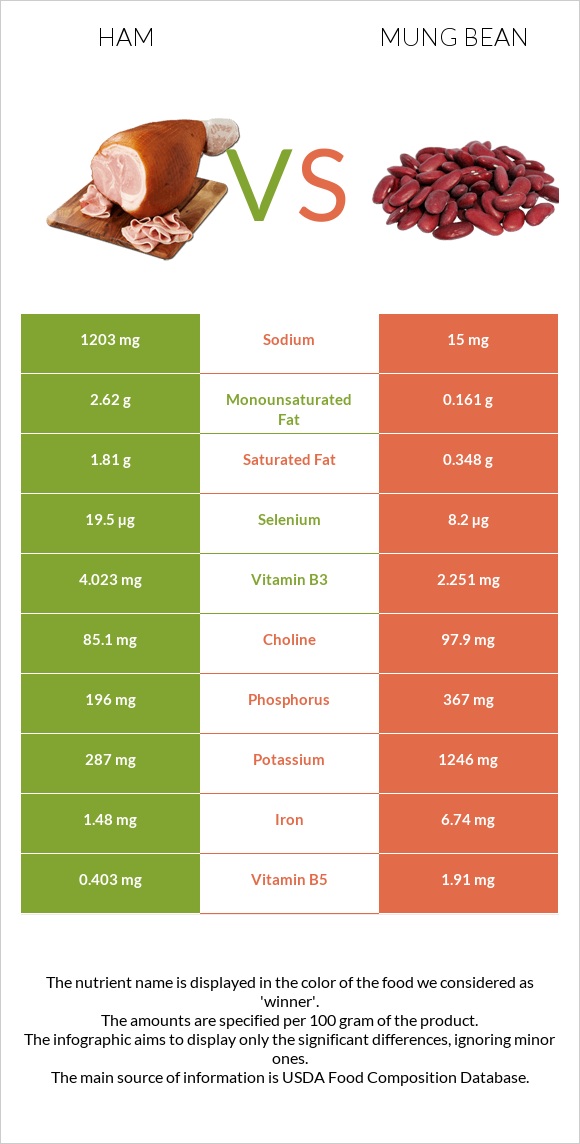
All nutrients comparison - raw data values
Nutrient
DV% diff.
Folate
3µg
625µg
156%
Copper
0.079mg
0.941mg
96%
Iron
1.48mg
6.74mg
66%
Fiber
0g
16.3g
65%
Sodium
1203mg
15mg
52%
Manganese
0.054mg
1.035mg
43%
Magnesium
14mg
189mg
42%
Vitamin B5
0.403mg
1.91mg
30%
Potassium
287mg
1246mg
28%
Vitamin B12
0.65µg
0µg
27%
Phosphorus
196mg
367mg
24%
Selenium
19.5µg
8.2µg
21%
Carbs
1.5g
62.62g
20%
Cholesterol
53mg
0mg
18%
Calcium
8mg
132mg
12%
Vitamin B1
0.754mg
0.621mg
11%
Vitamin B3
4.023mg
2.251mg
11%
Calories
145kcal
347kcal
10%
Vitamin K
0µg
9µg
8%
Fats
5.53g
1.15g
7%
Saturated fat
1.81g
0.348g
7%
Protein
20.93g
23.86g
6%
Monounsaturated fat
2.62g
0.161g
6%
Vitamin C
0mg
4.8mg
5%
Vitamin D*
32 IU
0 IU
4%
Vitamin D
0.8µg
0µg
4%
Zinc
2.88mg
2.68mg
2%
Vitamin E
0.25mg
0.51mg
2%
Vitamin B2
0.202mg
0.233mg
2%
Choline
85.1mg
97.9mg
2%
Vitamin A
0µg
6µg
1%
Vitamin B6
0.4mg
0.382mg
1%
Polyunsaturated fat
0.54g
0.384g
1%
Protein per 100 calories
14g
6.9g
N/A
Calories per 10 g protein
69kcal
145kcal
N/A
Weight per 100 calories
69g
29g
N/A
Unsaturated / Saturated Fat ratio
1.7
1.6
N/A
Net carbs
1.5g
46.32g
N/A
Sugar
0g
6.6g
N/A
Tryptophan
0.251mg
0.26mg
0%
Threonine
0.931mg
0.782mg
0%
Isoleucine
0.918mg
1.008mg
0%
Leucine
1.661mg
1.847mg
0%
Lysine
1.775mg
1.664mg
0%
Methionine
0.553mg
0.286mg
0%
Phenylalanine
0.904mg
1.443mg
0%
Valine
0.908mg
1.237mg
0%
Histidine
0.75mg
0.695mg
0%
Macronutrient Comparison
Macronutrient breakdown side-by-side comparison
3
21%
6%
68%
4%
Protein:
20.93 g
Fats:
5.53 g
Carbs:
1.5 g
Water:
67.67 g
Other:
4.37 g
2
24%
63%
9%
3%
Protein:
23.86 g
Fats:
1.15 g
Carbs:
62.62 g
Water:
9.05 g
Other:
3.32 g
Contains
more
Fats Fats
+380.9%
Contains
more
Water Water
+647.7%
Contains
more
Other Other
+31.6%
Contains
more
Protein Protein
+14%
Contains
more
Carbs Carbs
+4074.7%
Fat Type Comparison
Fat type breakdown side-by-side comparison
2
36%
53%
11%
Saturated fat:
Sat. Fat
1.81 g
Monounsaturated fat:
Mono. Fat
2.62 g
Polyunsaturated fat:
Poly. Fat
0.54 g
1
39%
18%
43%
Saturated fat:
Sat. Fat
0.348 g
Monounsaturated fat:
Mono. Fat
0.161 g
Polyunsaturated fat:
Poly. Fat
0.384 g
Contains
more
Mono. Fat Monounsaturated fat
+1527.3%
Contains
more
Poly. Fat Polyunsaturated fat
+40.6%
Contains
less
Sat. Fat Saturated fat
-80.8%