
Hyacinth-beans, immature seeds, cooked, boiled, drained, with salt vs. Bean raw — In-Depth Nutrition Comparison
Compare
Significant differences between hyacinth-beans, immature seeds, cooked, boiled, drained, with salt and bean raw
- The amount of folate, copper, vitamin B1, iron, phosphorus, selenium, protein, manganese, vitamin B6, and potassium in bean raw is higher than in hyacinth-beans, immature seeds, cooked, boiled, drained, with salt.
- Bean raw covers your daily folate needs 120% more than hyacinth-beans, immature seeds, cooked, boiled, drained, with salt.
Specific food types used in this comparison are Hyacinth-beans, immature seeds, cooked, boiled, drained, with salt and Beans, pinto, mature seeds, raw.
Infographic
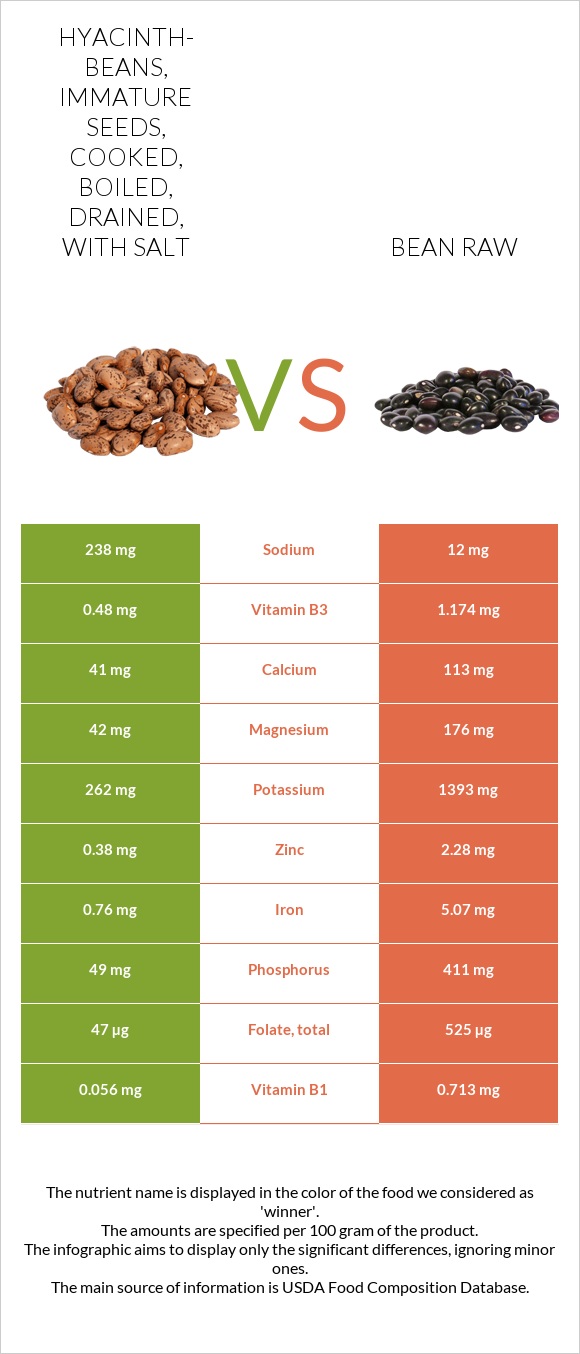
Infographic link
Mineral Comparison
The mineral comparison score is based on which food has a more favorable amount of each mineral. The �coverage� charts below show how much of the daily mineral needs are covered by the selected amount of each food.
| Contains more MagnesiumMagnesium | +319% |
| Contains more CalciumCalcium | +175.6% |
| Contains more PotassiumPotassium | +431.7% |
| Contains more IronIron | +567.1% |
| Contains more CopperCopper | +1760.4% |
| Contains more ZincZinc | +500% |
| Contains more PhosphorusPhosphorus | +738.8% |
| Contains less SodiumSodium | -95% |
| Contains more ManganeseManganese | +446.7% |
| Contains more SeleniumSelenium | +1643.8% |
Vitamin Comparison
The vitamin comparison score is based on the number of vitamins in which one food is richer than the other. The �coverage� charts below show how much of the daily vitamin needs are covered by the selected amount of each food.
| Contains more Vitamin AVitamin A | +∞% |
| Contains more Vitamin CVitamin C | +23.5% |
| Contains more Vitamin EVitamin E | +∞% |
| Contains more Vitamin B1Vitamin B1 | +1173.2% |
| Contains more Vitamin B2Vitamin B2 | +140.9% |
| Contains more Vitamin B3Vitamin B3 | +144.6% |
| Contains more Vitamin B5Vitamin B5 | +1381.1% |
| Contains more Vitamin B6Vitamin B6 | +1960.9% |
| Contains more Vitamin KVitamin K | +∞% |
| Contains more FolateFolate | +1017% |
All nutrients comparison - raw data values
| Nutrient |  |
 |
DV% diff. |
| Folate | 47µg | 525µg | 120% |
| Copper | 0.048mg | 0.893mg | 94% |
| Fiber | 15.5g | 62% | |
| Vitamin B1 | 0.056mg | 0.713mg | 55% |
| Iron | 0.76mg | 5.07mg | 54% |
| Phosphorus | 49mg | 411mg | 52% |
| Selenium | 1.6µg | 27.9µg | 48% |
| Manganese | 0.21mg | 1.148mg | 41% |
| Protein | 2.95g | 21.42g | 37% |
| Vitamin B6 | 0.023mg | 0.474mg | 35% |
| Potassium | 262mg | 1393mg | 33% |
| Magnesium | 42mg | 176mg | 32% |
| Carbs | 9.2g | 62.55g | 18% |
| Zinc | 0.38mg | 2.28mg | 17% |
| Calories | 50kcal | 347kcal | 15% |
| Vitamin B5 | 0.053mg | 0.785mg | 15% |
| Starch | 34.17g | 14% | |
| Choline | 66.2mg | 12% | |
| Sodium | 238mg | 12mg | 10% |
| Vitamin B2 | 0.088mg | 0.212mg | 10% |
| Calcium | 41mg | 113mg | 7% |
| Vitamin K | 5.6µg | 5% | |
| Vitamin B3 | 0.48mg | 1.174mg | 4% |
| Polyunsaturated fat | 0.01g | 0.407g | 3% |
| Fats | 0.27g | 1.23g | 1% |
| Vitamin C | 5.1mg | 6.3mg | 1% |
| Vitamin A | 7µg | 0µg | 1% |
| Vitamin E | 0.21mg | 1% | |
| Saturated fat | 0.119g | 0.235g | 1% |
| Protein per 100 calories | 5.9g | 6.2g | N/A |
| Calories per 10 g protein | 169kcal | 162kcal | N/A |
| Weight per 100 calories | 200g | 29g | N/A |
| Net carbs | 9.2g | 47.05g | N/A |
| Sugar | 2.11g | N/A | |
| Monounsaturated fat | 0.129g | 0.229g | 0% |
| Tryptophan | 0.237mg | 0% | |
| Threonine | 0.124mg | 0.81mg | 0% |
| Isoleucine | 0.201mg | 0.871mg | 0% |
| Leucine | 0.307mg | 1.558mg | 0% |
| Lysine | 0.203mg | 1.356mg | 0% |
| Methionine | 0.026mg | 0.259mg | 0% |
| Phenylalanine | 0.065mg | 1.095mg | 0% |
| Valine | 0.218mg | 0.998mg | 0% |
| Histidine | 0.124mg | 0.556mg | 0% |
Macronutrient Comparison
Macronutrient breakdown side-by-side comparison
Protein:
2.95 g
Fats:
0.27 g
Carbs:
9.2 g
Water:
86.9 g
Other:
0.68 g
Protein:
21.42 g
Fats:
1.23 g
Carbs:
62.55 g
Water:
11.33 g
Other:
3.47 g
| Contains more WaterWater | +667% |
| Contains more ProteinProtein | +626.1% |
| Contains more FatsFats | +355.6% |
| Contains more CarbsCarbs | +579.9% |
Fat Type Comparison
Fat type breakdown side-by-side comparison
Saturated fat:
Sat. Fat
0.119 g
Monounsaturated fat:
Mono. Fat
0.129 g
Polyunsaturated fat:
Poly. Fat
0.01 g
Saturated fat:
Sat. Fat
0.235 g
Monounsaturated fat:
Mono. Fat
0.229 g
Polyunsaturated fat:
Poly. Fat
0.407 g
| Contains less Sat. FatSaturated fat | -49.4% |
| Contains more Mono. FatMonounsaturated fat | +77.5% |
| Contains more Poly. FatPolyunsaturated fat | +3970% |