Ice creams, french vanilla, soft-serve vs. Mars — In-Depth Nutrition Comparison
Compare
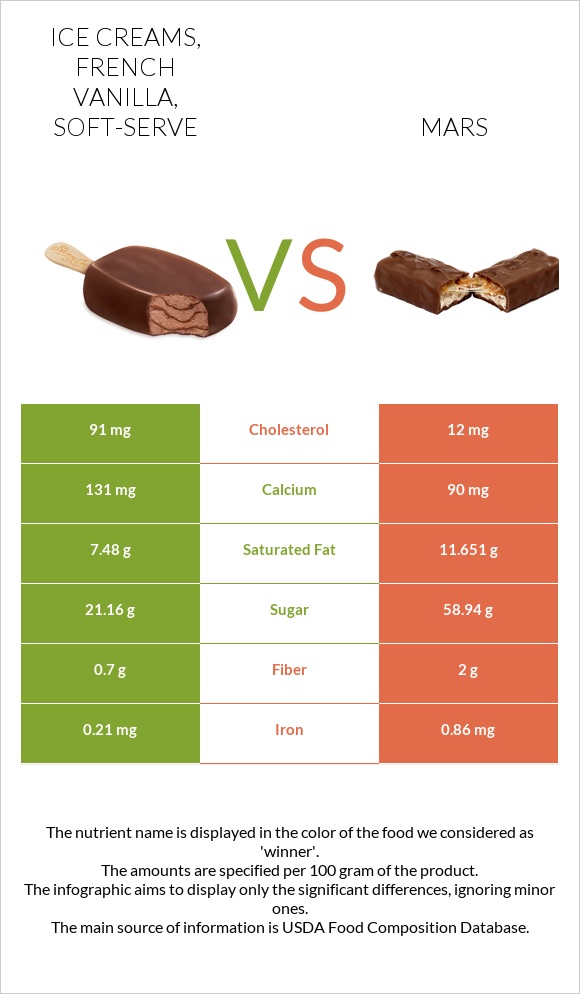
Important differences between ice creams, french vanilla, soft-serve and mars
- Ice creams, french vanilla, soft-serve has more vitamin A; however, mars is richer in iron and fiber.
- Ice creams, french vanilla, soft-serve's daily need coverage for cholesterol is 26% more.
- Ice creams, french vanilla, soft-serve contains 4 times more vitamin A than mars. Ice creams, french vanilla, soft-serve contains 589 IU of vitamin A, while mars contains 167 IU.
- Mars contains less cholesterol.
The food varieties used in the comparison are Ice creams, french vanilla, soft-serve and Candies, MARS SNACKFOOD US, M&M's Crispy Chocolate Candies.
Infographic
Infographic link
Mineral Comparison
Mineral comparison score is based on the number of minerals by which one or the other food is richer. The "coverage" charts below show how much of the daily needs can be covered by 300 grams of the food.
| Contains more MagnesiumMagnesium | +∞% |
| Contains more CalciumCalcium | +45.6% |
| Contains more PotassiumPotassium | +∞% |
| Contains more CopperCopper | +∞% |
| Contains more ZincZinc | +∞% |
| Contains more PhosphorusPhosphorus | +∞% |
| Contains less SodiumSodium | -55.1% |
| Contains more ManganeseManganese | +∞% |
| Contains more SeleniumSelenium | +∞% |
| Contains more IronIron | +309.5% |
Vitamin Comparison
Vitamin comparison score is based on the number of vitamins by which one or the other food is richer. The "coverage" charts below show how much of the daily needs can be covered by 300 grams of the food.
| Contains more Vitamin CVitamin C | +60% |
| Contains more Vitamin DVitamin D | +∞% |
| Contains more Vitamin AVitamin A | +∞% |
| Contains more Vitamin EVitamin E | +∞% |
| Contains more Vitamin B1Vitamin B1 | +∞% |
| Contains more Vitamin B2Vitamin B2 | +∞% |
| Contains more Vitamin B3Vitamin B3 | +∞% |
| Contains more Vitamin B5Vitamin B5 | +∞% |
| Contains more Vitamin B6Vitamin B6 | +∞% |
| Contains more Vitamin B12Vitamin B12 | +∞% |
| Contains more Vitamin KVitamin K | +∞% |
| Contains more FolateFolate | +∞% |
All nutrients comparison - raw data values
| Nutrient |  |
 |
DV% diff. |
| Cholesterol | 91mg | 12mg | 26% |
| Vitamin B12 | 0.5µg | 21% | |
| Saturated fat | 7.48g | 11.651g | 19% |
| Vitamin A | 162µg | 18% | |
| Carbs | 22.2g | 72.4g | 17% |
| Phosphorus | 116mg | 17% | |
| Vitamin B2 | 0.182mg | 14% | |
| Calories | 222kcal | 475kcal | 13% |
| Fats | 13g | 19.32g | 10% |
| Vitamin B5 | 0.506mg | 10% | |
| Monounsaturated fat | 3.49g | 9% | |
| Iron | 0.21mg | 0.86mg | 8% |
| Potassium | 177mg | 5% | |
| Fiber | 0.7g | 2g | 5% |
| Zinc | 0.52mg | 5% | |
| Selenium | 3µg | 5% | |
| Choline | 26mg | 5% | |
| Vitamin D* | 29 IU | 4% | |
| Vitamin D | 0.7µg | 4% | |
| Calcium | 131mg | 90mg | 4% |
| Vitamin E | 0.61mg | 4% | |
| Vitamin B1 | 0.049mg | 4% | |
| Vitamin B6 | 0.048mg | 4% | |
| Magnesium | 12mg | 3% | |
| Copper | 0.03mg | 3% | |
| Sodium | 61mg | 136mg | 3% |
| Polyunsaturated fat | 0.45g | 3% | |
| Folate | 9µg | 2% | |
| Vitamin B3 | 0.095mg | 1% | |
| Vitamin K | 0.9µg | 1% | |
| Protein | 4.1g | 4.28g | 0% |
| Protein per 100 calories | 1.8g | 0.9g | N/A |
| Calories per 10 g protein | 541kcal | 1110kcal | N/A |
| Weight per 100 calories | 45g | 21g | N/A |
| Unsaturated / Saturated Fat ratio | 0.53 | 0 | N/A |
| Vitamin C | 0.8mg | 0.5mg | 0% |
| Net carbs | 21.5g | 70.4g | N/A |
| Sugar | 21.16g | 58.94g | N/A |
| Manganese | 0.005mg | 0% | |
| Trans fat | 0.131g | N/A | |
| Tryptophan | 0.048mg | 0% | |
| Threonine | 0.169mg | 0% | |
| Isoleucine | 0.215mg | 0% | |
| Leucine | 0.353mg | 0% | |
| Lysine | 0.296mg | 0% | |
| Methionine | 0.091mg | 0% | |
| Phenylalanine | 0.176mg | 0% | |
| Valine | 0.241mg | 0% | |
| Histidine | 0.099mg | 0% |
Macronutrient Comparison
Macronutrient breakdown side-by-side comparison
Protein:
4.1 g
Fats:
13 g
Carbs:
22.2 g
Water:
59.8 g
Other:
0.9 g
Protein:
4.28 g
Fats:
19.32 g
Carbs:
72.4 g
Water:
1.7 g
Other:
2.3 g
| Contains more WaterWater | +3417.6% |
| Contains more FatsFats | +48.6% |
| Contains more CarbsCarbs | +226.1% |
| Contains more OtherOther | +155.6% |
~equal in
Protein
~4.28g
Fat Type Comparison
Fat type breakdown side-by-side comparison
Saturated fat:
Sat. Fat
7.48 g
Monounsaturated fat:
Mono. Fat
3.49 g
Polyunsaturated fat:
Poly. Fat
0.45 g
Saturated fat:
Sat. Fat
11.651 g
Monounsaturated fat:
Mono. Fat
0 g
Polyunsaturated fat:
Poly. Fat
0 g
| Contains less Sat. FatSaturated fat | -35.8% |
| Contains more Mono. FatMonounsaturated fat | +∞% |
| Contains more Poly. FatPolyunsaturated fat | +∞% |