Nuts, almonds, oil roasted, with salt added, smoke flavor vs. Hazelnut — In-Depth Nutrition Comparison
Compare
What are the differences between nuts, almonds, oil roasted, with salt added, smoke flavor and hazelnut?
- Nuts, almonds, oil roasted, with salt added, smoke flavor is higher in vitamin E, magnesium, and calcium, yet hazelnut is higher in iron and vitamin C.
- Nuts, almonds, oil roasted, with salt added, smoke flavor's daily need coverage for vitamin E is 67% more.
We used Nuts, almonds, oil roasted, with salt added, smoke flavor and Nuts, hazelnuts or filberts types in this article.
Infographic
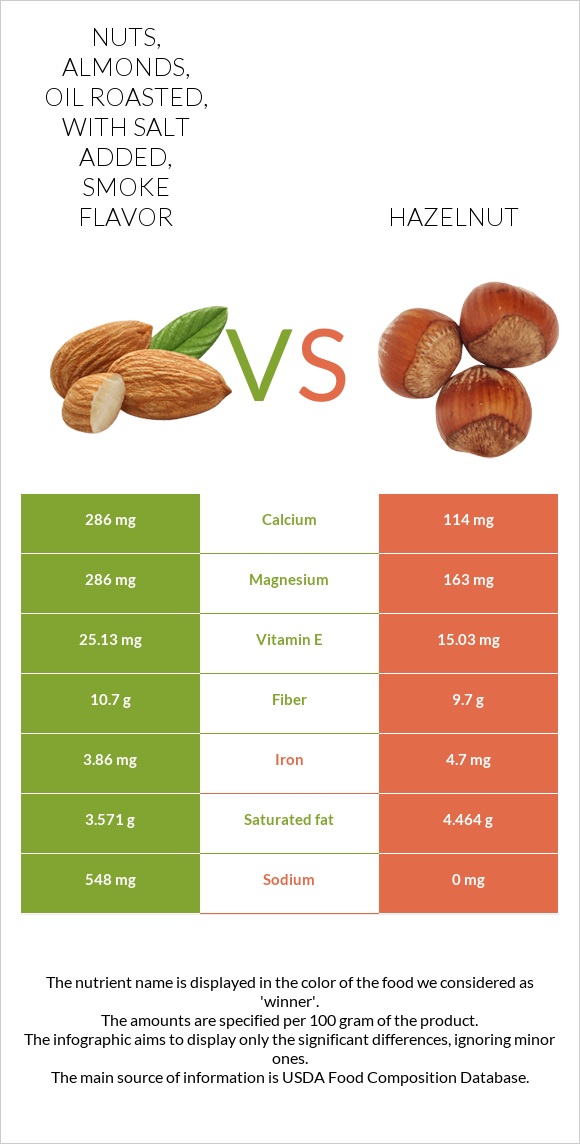
Infographic link
Mineral Comparison
Mineral comparison score is based on the number of minerals by which one or the other food is richer. The "coverage" charts below show how much of the daily needs can be covered by 300 grams of the food.
| Contains more MagnesiumMagnesium | +75.5% |
| Contains more CalciumCalcium | +150.9% |
| Contains more IronIron | +21.8% |
| Contains less SodiumSodium | -100% |
Vitamin Comparison
Vitamin comparison score is based on the number of vitamins by which one or the other food is richer. The "coverage" charts below show how much of the daily needs can be covered by 300 grams of the food.
| Contains more Vitamin EVitamin E | +67.2% |
| Contains more Vitamin CVitamin C | +∞% |
All nutrients comparison - raw data values
| Nutrient |  |
 |
DV% diff. |
| Manganese | 6.175mg | 268% | |
| Copper | 1.725mg | 192% | |
| Monounsaturated fat | 45.652g | 114% | |
| Vitamin E | 25.13mg | 15.03mg | 67% |
| Vitamin B1 | 0.643mg | 54% | |
| Polyunsaturated fat | 7.92g | 53% | |
| Vitamin B6 | 0.563mg | 43% | |
| Phosphorus | 290mg | 41% | |
| Magnesium | 286mg | 163mg | 29% |
| Folate | 113µg | 28% | |
| Sodium | 548mg | 0mg | 24% |
| Zinc | 2.45mg | 22% | |
| Vitamin B5 | 0.918mg | 18% | |
| Calcium | 286mg | 114mg | 17% |
| Protein | 21.43g | 14.95g | 13% |
| Vitamin K | 14.2µg | 12% | |
| Iron | 3.86mg | 4.7mg | 11% |
| Vitamin B3 | 1.8mg | 11% | |
| Vitamin B2 | 0.113mg | 9% | |
| Choline | 45.6mg | 8% | |
| Fats | 55.89g | 60.75g | 7% |
| Vitamin C | 0mg | 6.3mg | 7% |
| Fiber | 10.7g | 9.7g | 4% |
| Selenium | 2.4µg | 4% | |
| Saturated fat | 3.571g | 4.464g | 4% |
| Calories | 607kcal | 628kcal | 1% |
| Protein per 100 calories | 3.5g | 2.4g | N/A |
| Calories per 10 g protein | 283kcal | 420kcal | N/A |
| Weight per 100 calories | 16g | 16g | N/A |
| Unsaturated / Saturated Fat ratio | 0 | 12 | N/A |
| Net carbs | 7.16g | 7g | N/A |
| Carbs | 17.86g | 16.7g | 0% |
| Potassium | 679mg | 680mg | 0% |
| Sugar | 3.57g | 4.34g | N/A |
| Starch | 0.48g | 0% | |
| Vitamin A | 1µg | 0% | |
| Tryptophan | 0.193mg | 0% | |
| Threonine | 0.497mg | 0% | |
| Isoleucine | 0.545mg | 0% | |
| Leucine | 1.063mg | 0% | |
| Lysine | 0.42mg | 0% | |
| Methionine | 0.221mg | 0% | |
| Phenylalanine | 0.663mg | 0% | |
| Valine | 0.701mg | 0% | |
| Histidine | 0.432mg | 0% | |
| Fructose | 0.07g | 0% |
Macronutrient Comparison
Macronutrient breakdown side-by-side comparison
Protein:
21.43 g
Fats:
55.89 g
Carbs:
17.86 g
Water:
2.8 g
Other:
2.02 g
Protein:
14.95 g
Fats:
60.75 g
Carbs:
16.7 g
Water:
5.31 g
Other:
2.29 g
| Contains more ProteinProtein | +43.3% |
| Contains more WaterWater | +89.6% |
| Contains more OtherOther | +13.4% |
~equal in
Fats
~60.75g
~equal in
Carbs
~16.7g
Fat Type Comparison
Fat type breakdown side-by-side comparison
Saturated fat:
Sat. Fat
3.571 g
Monounsaturated fat:
Mono. Fat
0 g
Polyunsaturated fat:
Poly. Fat
0 g
Saturated fat:
Sat. Fat
4.464 g
Monounsaturated fat:
Mono. Fat
45.652 g
Polyunsaturated fat:
Poly. Fat
7.92 g
| Contains less Sat. FatSaturated fat | -20% |