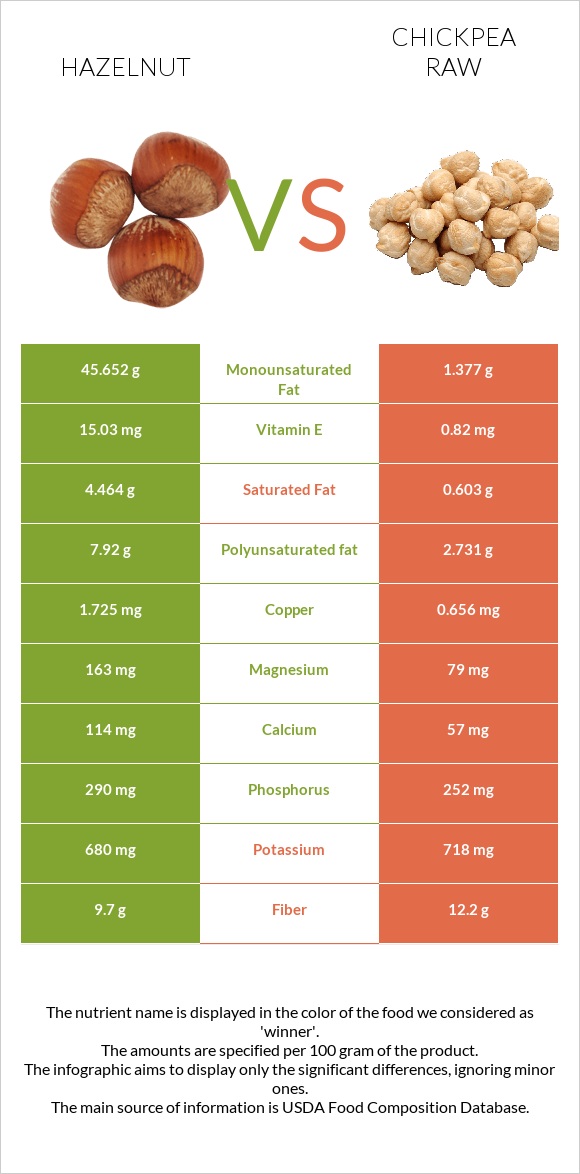
Hazelnut vs. Chickpea raw — Health Impact and Nutrition Comparison


Summary
Hazelnut contains more copper, magnesium, Vitamin E, and Vitamin B1 and less sugar and sodium than a chickpea. Chickpeas are richer in manganese, folate, Vitamin B5, and fiber and have less saturated fat than hazelnuts. The glycemic index of hazelnut is lower.
Introduction
Nuts and legumes have been used since ancient times and are known as one of the healthiest foods. We'll dig deeper into the differences and similarities between chickpeas and hazelnut and discover which one is more suitable for you.
What's The Actual Difference?
The main difference between chickpea and hazelnut is that chickpea is classified as a legume, while hazelnut is classified as a nut.
On the outside, these two are also distinct: hazelnut is oval in shape and yellow to brown, 8-12 cm long and 4.5-8 cm wide, whereas chickpeas are wrinkled and can be brown, yellow, orange, black, or green, 10-12 mm.
Nutrition
You can find nutritional infographics at the bottom of this page that visually show the differences between chickpeas and hazelnut.
Calories
Hazelnuts' calories mainly come from their fat content. Although a chickpea has more carbs than a hazelnut, the number of calories in a hazelnut is two times higher than in a chickpea. It has 628 calories per 100g, whereas chickpea contains 378 per 100g.
Fats
Hazelnut has ten times higher fat content than a chickpea.
In particular, it contains 60.75g of total fats, while chickpea has only 6g of fats.
Hazelnut falls in the range of the top 2% of foods as a source of fat. It is also high in saturated fat (5g), polyunsaturated (8g), and monounsaturated fats (46g) accordingly.
Carbs
Chickpea contains four times higher levels of carbs. It falls in the range of the top 15% of foods as a source of carbs, containing 62.95g of carbs per 100g. Of that 62.95g, 12g is fiber, and 50.75g is net carbs.
Hazelnuts have only 16.7g of carbs per 100g, of which 9.7g is fiber and 7g are net carbs.
Cholesterol
Hazelnut and chickpea have no cholesterol.
Protein
Chickpea is richer in protein than hazelnut. It provides 20.47g of protein 100g, while hazelnut has 14.95g. Chickpea falls in the range of the top 23% of foods as a source of protein. It is relatively high in tryptophan, threonine, isoleucine, phenylalanine, valine, histidine, lysine, and methionine.
Macronutrient Comparison
Contains
more
FatsFats
+905.8%
Contains
more
ProteinProtein
+36.9%
Contains
more
CarbsCarbs
+276.9%
Contains
more
WaterWater
+44.6%
Contains
more
OtherOther
+24.9%
Minerals
Hazelnut is relatively high in minerals. It has more calcium, phosphorus, copper, magnesium, and less sodium than a chickpea.
On the other hand, chickpea contains more zinc.
Both chickpeas and hazelnut are rich in potassium. Both fall in the range of the top 9% of foods as a source of potassium.
They both have an equal iron amount.
Mineral Comparison
Contains
more
MagnesiumMagnesium
+106.3%
Contains
more
CalciumCalcium
+100%
Contains
more
CopperCopper
+163%
Contains
more
PhosphorusPhosphorus
+15.1%
Contains
less
SodiumSodium
-100%
Contains
more
SeleniumSelenium
+∞%
Contains
more
ZincZinc
+12.7%
Contains
more
ManganeseManganese
+245%
Vitamins
Hazelnut contains a significantly higher amount of Vitamin E, Vitamin C, Vitamin B3, Vitamin B, and Vitamin K.
It falls in the top 14% of foods as a source of Vitamin B1, covering half of your daily need for this vitamin.
Chickpea has more Vitamin A, Vitamin B2, Vitamin B65, and folate.
Both lack Vitamin B12 and Vitamin D.
Vitamin Comparison
Contains
more
Vitamin CVitamin C
+57.5%
Contains
more
Vitamin EVitamin E
+1732.9%
Contains
more
Vitamin B1Vitamin B1
+34.8%
Contains
more
Vitamin B3Vitamin B3
+16.8%
Contains
more
Vitamin KVitamin K
+57.8%
Contains
more
Vitamin AVitamin A
+200%
Contains
more
Vitamin B2Vitamin B2
+87.6%
Contains
more
Vitamin B5Vitamin B5
+73%
Contains
more
FolateFolate
+392.9%
Glycemic Index
The estimated glycemic index of chickpeas is 36, whereas the glycemic index of hazelnut is about 15. Hazelnut is considered a low-GI food.
Health Benefits
Diabetes
Science shows that nuts like hazelnuts can help lower blood sugar levels. According to one study (1), the oleic acid in hazelnuts improves insulin sensitivity.
Another study (2) indicates that a diet high in these nuts can prevent the reduction of HDL-C concentrations in type 2 diabetes patients. Hazelnut consumers have a lower risk of diabetes than non-nut consumers based on self-report and fasting blood glucose levels.
Chickpeas are associated with lower post-prandial glucose levels and higher satiety after meals because of their rich fiber content. This has positive associations with insulin resistance and type 2 diabetes (12).
Cancer
Consuming chickpeas may increase the production of butyrate, which may reduce inflammation in colon cells and thus reduce the risk of colon cancer. Chickpeas contain lycopene and saponins, which have anti-cancer properties in the body (3).
Hazelnuts are high in Vitamin E, making them an excellent source of natural antioxidants, which may inhibit the growth of human cancer cells. Furthermore, hazelnuts are high in Vitamin B6, which may aid in treating various cancers (4,5).
One study [6] discovered that hazelnut extract has antiproliferative activity against human melanoma and cervical cancer (HeLa) due to its phenolic compounds.
Cardiovascular Health
Hazelnuts and chickpeas are both nutritious foods that can contribute to cardiovascular health, although they provide different sets of nutrients:
Hazelnuts:
- Hazelnuts are rich in heart-healthy monounsaturated fats. These fats have been associated with improved blood lipid profiles, including lower LDL (“bad” cholesterol) levels (7).
- They are a good source of vitamin E, an antioxidant that helps protect LDL cholesterol from oxidation, reducing the risk of atherosclerosis (8).
- Hazelnuts also contain arginine, an amino acid that helps relax blood vessels, promote healthy blood flow, and potentially reduce blood pressure.
Chickpeas (Raw):
- Chickpeas are high in dietary fiber, particularly soluble fiber, which can help lower LDL cholesterol levels and improve heart health (9).
- They are also a good source of plant-based protein, which can be beneficial for cardiovascular health when substituted for animal proteins higher in saturated fat.
- Chickpeas contain various vitamins and minerals, including folate, potassium, and magnesium, which play roles in maintaining heart health and regulating blood pressure.
In summary, both hazelnuts and raw chickpeas can contribute to cardiovascular health in different ways. Hazelnuts provide heart-healthy fats and antioxidants, while chickpeas offer fiber, plant-based protein, and various nutrients. Including a variety of nuts, seeds, legumes, and other whole foods in your diet can help promote heart health and reduce the risk of cardiovascular disease.
Downsides and Risks
Allergy
Patients who are allergic to tree pollens are frequently allergic to hazelnuts. Itching, swelling, and burning sensations in the mouth and throat are common symptoms (10).
Chickpeas can cause IgE-mediated hypersensitivity symptoms ranging from rhinitis to anaphylaxis. Redness, rashes, hives, and inflammation are common symptoms (11).
References
- https://www.ncbi.nlm.nih.gov/pmc/articles/PMC6637671/
- https://www.ncbi.nlm.nih.gov/pmc/articles/PMC3793377/
- https://www.ncbi.nlm.nih.gov/pmc/articles/PMC2928447/
- https://www.ishs.org/ishs-article/445_39
- https://www.ncbi.nlm.nih.gov/pmc/articles/PMC5988249/
- https://www.ncbi.nlm.nih.gov/pmc/articles/PMC5343927/
- https://pubmed.ncbi.nlm.nih.gov/27897978/
- https://pubmed.ncbi.nlm.nih.gov/9772122/
- https://pubmed.ncbi.nlm.nih.gov/17191025/
- https://www.ncbi.nlm.nih.gov/pmc/articles/PMC7811165/
- https://link.springer.com/article/10.1007%2Fs12016-012-8310-6
- https://www.ncbi.nlm.nih.gov/pmc/articles/PMC5336455/

Infographic
All nutrients comparison - raw data values
| Nutrient | |
|
DV% diff. |
| Manganese | 6.175mg | 21.306mg | 658% |
| Copper | 1.725mg | 0.656mg | 119% |
| Folate | 113µg | 557µg | 111% |
| Monounsaturated fat | 45.652g | 1.377g | 111% |
| Vitamin E | 15.03mg | 0.82mg | 95% |
| Fats | 60.75g | 6.04g | 84% |
| Polyunsaturated fat | 7.92g | 2.731g | 35% |
| Magnesium | 163mg | 79mg | 20% |
| Saturated fat | 4.464g | 0.603g | 18% |
| Carbs | 16.7g | 62.95g | 15% |
| Vitamin B1 | 0.643mg | 0.477mg | 14% |
| Calories | 628kcal | 378kcal | 13% |
| Vitamin B5 | 0.918mg | 1.588mg | 13% |
| Protein | 14.95g | 20.47g | 11% |
| Fiber | 9.7g | 12.2g | 10% |
| Choline | 45.6mg | 99.3mg | 10% |
| Vitamin B2 | 0.113mg | 0.212mg | 8% |
| Calcium | 114mg | 57mg | 6% |
| Iron | 4.7mg | 4.31mg | 5% |
| Phosphorus | 290mg | 252mg | 5% |
| Selenium | 2.4µg | 0µg | 4% |
| Vitamin K | 14.2µg | 9µg | 4% |
| Vitamin C | 6.3mg | 4mg | 3% |
| Zinc | 2.45mg | 2.76mg | 3% |
| Vitamin B3 | 1.8mg | 1.541mg | 2% |
| Vitamin B6 | 0.563mg | 0.535mg | 2% |
| Potassium | 680mg | 718mg | 1% |
| Sodium | 0mg | 24mg | 1% |
| Protein per 100 calories | 2.4g | 5.4g | N/A |
| Calories per 10 g protein | 420kcal | 185kcal | N/A |
| Weight per 100 calories | 16g | 26g | N/A |
| Unsaturated / Saturated Fat ratio | 12 | 6.8 | N/A |
| Net carbs | 7g | 50.75g | N/A |
| Sugar | 4.34g | 10.7g | N/A |
| Starch | 0.48g | 0% | |
| Vitamin A | 1µg | 3µg | 0% |
| Tryptophan | 0.193mg | 0.2mg | 0% |
| Threonine | 0.497mg | 0.766mg | 0% |
| Isoleucine | 0.545mg | 0.882mg | 0% |
| Leucine | 1.063mg | 1.465mg | 0% |
| Lysine | 0.42mg | 1.377mg | 0% |
| Methionine | 0.221mg | 0.27mg | 0% |
| Phenylalanine | 0.663mg | 1.103mg | 0% |
| Valine | 0.701mg | 0.865mg | 0% |
| Histidine | 0.432mg | 0.566mg | 0% |
| Fructose | 0.07g | 0% |
Fat Type Comparison
| Contains more Mono. FatMonounsaturated fat | +3215.3% |
| Contains more Poly. FatPolyunsaturated fat | +190% |
| Contains less Sat. FatSaturated fat | -86.5% |
References
All the values for which the sources are not specified explicitly are taken from FDA’s Food Central. The exact link to the food presented on this page can be found below.
- Hazelnut - https://fdc.nal.usda.gov/fdc-app.html#/food-details/170581/nutrients
- Chickpea raw - https://fdc.nal.usda.gov/fdc-app.html#/food-details/173756/nutrients
All the Daily Values are presented for males aged 31-50, for 2000-calorie diets.