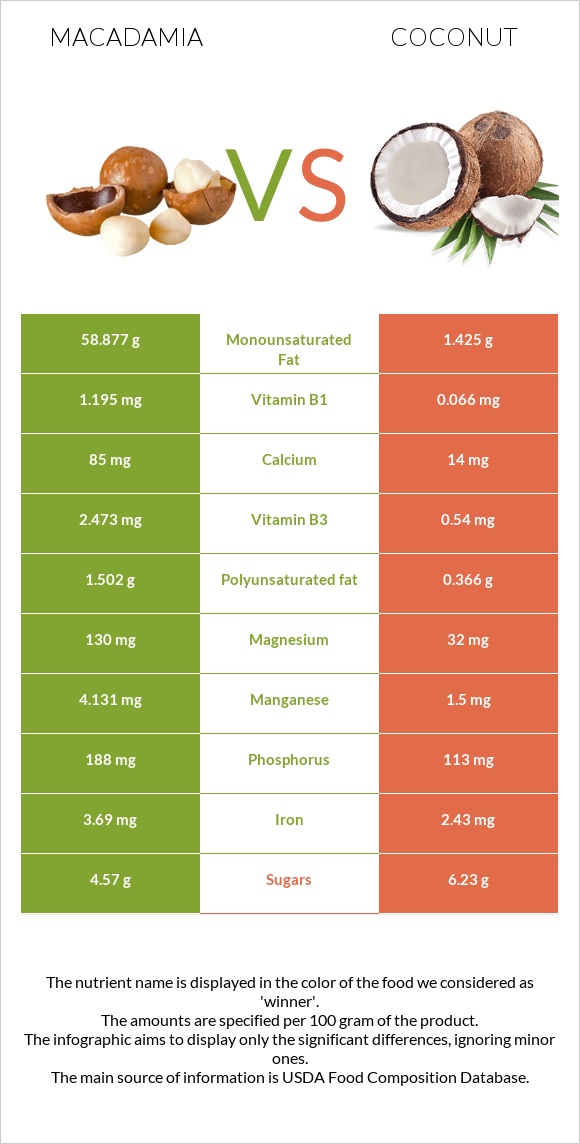
A recap on the differences between macadamia and coconut Macadamia has more manganese, vitamin B1, copper, magnesium, vitamin B6, iron, vitamin B3, and vitamin B2; however, coconut is higher in selenium. Macadamia covers your daily manganese needs 114% more than coconut. Coconut contains 18 times less vitamin B1 than macadamia. Macadamia contains 1.195mg of vitamin B1, while coconut contains 0.066mg. Macadamia has less saturated fat. The glycemic index of coconut is higher. Food varieties used in this article are Nuts, macadamia nuts, raw and Nuts, coconut meat, raw .
Infographic
Mineral Comparison
Mineral comparison score is based on the number of minerals by which one or the other food is richer. The "coverage" charts below show how much of the daily needs can be covered by 300 grams of the food.
8
100 g
300 g
1 oz (10-12 kernels) - 28.35g 1 cup, whole or halves - 134g
Magnesium
Magnesium
Calcium
Calcium
Potassium
Potassium
Iron
Iron
Copper
Copper
Zinc
Zinc
Phosphorus
Phosphorus
Sodium
Sodium
Manganese
Manganese
Selenium
Selenium
93%
26%
32%
138%
252%
35%
81%
0.65%
539%
20%
1
100 g
300 g
1 piece (2" x 2" x 1/2") - 45g 1 cup, shredded - 80g 1 medium - 397g
Magnesium
Magnesium
Calcium
Calcium
Potassium
Potassium
Iron
Iron
Copper
Copper
Zinc
Zinc
Phosphorus
Phosphorus
Sodium
Sodium
Manganese
Manganese
Selenium
Selenium
23%
4.2%
31%
91%
145%
30%
48%
2.6%
196%
55%
Vitamin Comparison
Vitamin comparison score is based on the number of vitamins by which one or the other food is richer. The "coverage" charts below show how much of the daily needs can be covered by 300 grams of the food.
6
100 g
300 g
1 oz (10-12 kernels) - 28.35g 1 cup, whole or halves - 134g
Vitamin C
Vit. C
Vitamin D
Vit. D
Vitamin A
Vit. A
Vitamin E
Vit. E
Vitamin B1
Vit. B1
Vitamin B2
Vit. B2
Vitamin B3
Vit. B3
Vitamin B5
Vit. B5
Vitamin B6
Vit. B6
Vitamin B12
Vit. B12
Vitamin K
Vit. K
Folate
Folate
4%
0%
0%
11%
299%
37%
46%
45%
63%
0%
0%
8.3%
3
100 g
300 g
1 piece (2" x 2" x 1/2") - 45g 1 cup, shredded - 80g 1 medium - 397g
Vitamin C
Vit. C
Vitamin D
Vit. D
Vitamin A
Vit. A
Vitamin E
Vit. E
Vitamin B1
Vit. B1
Vitamin B2
Vit. B2
Vitamin B3
Vit. B3
Vitamin B5
Vit. B5
Vitamin B6
Vit. B6
Vitamin B12
Vit. B12
Vitamin K
Vit. K
Folate
Folate
11%
0%
0%
4.8%
17%
4.6%
10%
18%
12%
0%
0.5%
20%
All nutrients comparison - raw data values
Nutrient
DV% diff.
Monounsaturated fat
58.877g
1.425g
144%
Manganese
4.131mg
1.5mg
114%
Vitamin B1
1.195mg
0.066mg
94%
Saturated fat
12.061g
29.698g
80%
Fats
75.77g
33.49g
65%
Copper
0.756mg
0.435mg
36%
Magnesium
130mg
32mg
23%
Calories
718kcal
354kcal
18%
Vitamin B6
0.275mg
0.054mg
17%
Iron
3.69mg
2.43mg
16%
Selenium
3.6µg
10.1µg
12%
Vitamin B3
2.473mg
0.54mg
12%
Phosphorus
188mg
113mg
11%
Vitamin B2
0.162mg
0.02mg
11%
Protein
7.91g
3.33g
9%
Vitamin B5
0.758mg
0.3mg
9%
Polyunsaturated fat
1.502g
0.366g
8%
Calcium
85mg
14mg
7%
Folate
11µg
26µg
4%
Vitamin C
1.2mg
3.3mg
2%
Fiber
8.6g
9g
2%
Zinc
1.3mg
1.1mg
2%
Vitamin E
0.54mg
0.24mg
2%
Choline
12.1mg
2%
Sodium
5mg
20mg
1%
Protein per 100 calories
1.1g
0.94g
N/A
Calories per 10 g protein
908kcal
1063kcal
N/A
Weight per 100 calories
14g
28g
N/A
Unsaturated / Saturated Fat ratio
5
0.06
N/A
Net carbs
5.22g
6.23g
N/A
Carbs
13.82g
15.23g
0%
Potassium
368mg
356mg
0%
Sugar
4.57g
6.23g
N/A
Starch
1.05g
0%
Vitamin K
0.2µg
0%
Tryptophan
0.067mg
0.039mg
0%
Threonine
0.37mg
0.121mg
0%
Isoleucine
0.314mg
0.131mg
0%
Leucine
0.602mg
0.247mg
0%
Lysine
0.018mg
0.147mg
0%
Methionine
0.023mg
0.062mg
0%
Phenylalanine
0.665mg
0.169mg
0%
Valine
0.363mg
0.202mg
0%
Histidine
0.195mg
0.077mg
0%
Fructose
0.07g
0%
Macronutrient Comparison
Macronutrient breakdown side-by-side comparison
3
8%
76%
14%
Protein:
7.91 g
Fats:
75.77 g
Carbs:
13.82 g
Water:
1.36 g
Other:
1.14 g
2
3%
33%
15%
47%
Protein:
3.33 g
Fats:
33.49 g
Carbs:
15.23 g
Water:
46.99 g
Other:
0.96 g
Contains
more
Protein Protein
+137.5%
Contains
more
Fats Fats
+126.2%
Contains
more
Other Other
+18.8%
Contains
more
Carbs Carbs
+10.2%
Contains
more
Water Water
+3355.1%
Fat Type Comparison
Fat type breakdown side-by-side comparison
3
17%
81%
2%
Saturated fat:
Sat. Fat
12.061 g
Monounsaturated fat:
Mono. Fat
58.877 g
Polyunsaturated fat:
Poly. Fat
1.502 g
0
94%
5%
Saturated fat:
Sat. Fat
29.698 g
Monounsaturated fat:
Mono. Fat
1.425 g
Polyunsaturated fat:
Poly. Fat
0.366 g
Contains
less
Sat. Fat Saturated fat
-59.4%
Contains
more
Mono. Fat Monounsaturated fat
+4031.7%
Contains
more
Poly. Fat Polyunsaturated fat
+310.4%