Significant differences between bran and wheat The amount of selenium, manganese, phosphorus, copper, vitamin B3, zinc, iron, vitamin B6, magnesium, and vitamin B1 in wheat is higher than in bran. Wheat covers your daily selenium needs 149% more than bran. Specific food types used in this comparison are Oat bran, cooked and Wheat, durum .
Infographic
Mineral Comparison
Mineral comparison score is based on the number of minerals by which one or the other food is richer. The "coverage" charts below show how much of the daily needs can be covered by 300 grams of the food.
1
100 g
300 g
1 cup - 219g
Magnesium
Magnesium
Calcium
Calcium
Potassium
Potassium
Iron
Iron
Copper
Copper
Zinc
Zinc
Phosphorus
Phosphorus
Sodium
Sodium
Manganese
Manganese
Selenium
Selenium
29%
3%
8.1%
33%
22%
14%
51%
0.13%
126%
42%
9
100 g
300 g
1 cup - 192g
Magnesium
Magnesium
Calcium
Calcium
Potassium
Potassium
Iron
Iron
Copper
Copper
Zinc
Zinc
Phosphorus
Phosphorus
Sodium
Sodium
Manganese
Manganese
Selenium
Selenium
103%
10%
38%
132%
184%
113%
218%
0.26%
393%
488%
Vitamin Comparison
Vitamin comparison score is based on the number of vitamins by which one or the other food is richer. The "coverage" charts below show how much of the daily needs can be covered by 300 grams of the food.
0
100 g
300 g
1 cup - 219g
Vitamin C
Vit. C
Vitamin D
Vit. D
Vitamin A
Vit. A
Vitamin E
Vit. E
Vitamin B1
Vit. B1
Vitamin B2
Vit. B2
Vitamin B3
Vit. B3
Vitamin B5
Vit. B5
Vitamin B6
Vit. B6
Vitamin B12
Vit. B12
Vitamin K
Vit. K
Folate
Folate
0%
0%
0%
0%
40%
7.8%
2.7%
13%
5.8%
0%
0%
4.5%
6
100 g
300 g
1 cup - 192g
Vitamin C
Vit. C
Vitamin D
Vit. D
Vitamin A
Vit. A
Vitamin E
Vit. E
Vitamin B1
Vit. B1
Vitamin B2
Vit. B2
Vitamin B3
Vit. B3
Vitamin B5
Vit. B5
Vitamin B6
Vit. B6
Vitamin B12
Vit. B12
Vitamin K
Vit. K
Folate
Folate
0%
0%
0%
0%
105%
28%
126%
56%
97%
0%
0%
32%
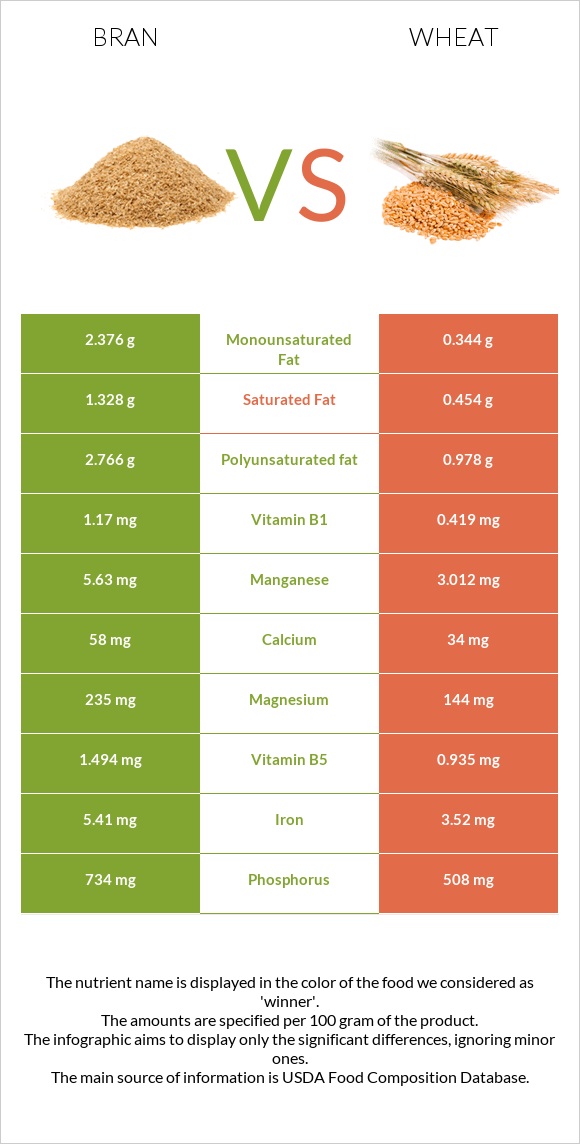
All nutrients comparison - raw data values
Nutrient
DV% diff.
Selenium
7.7µg
89.4µg
149%
Manganese
0.964mg
3.012mg
89%
Phosphorus
119mg
508mg
56%
Copper
0.066mg
0.553mg
54%
Vitamin B3
0.144mg
6.738mg
41%
Iron
0.88mg
3.52mg
33%
Zinc
0.53mg
4.16mg
33%
Vitamin B6
0.025mg
0.419mg
30%
Magnesium
40mg
144mg
25%
Vitamin B1
0.16mg
0.419mg
22%
Protein
3.21g
13.68g
21%
Carbs
11.44g
71.13g
20%
Calories
40kcal
339kcal
15%
Vitamin B5
0.217mg
0.935mg
14%
Potassium
92mg
431mg
10%
Fiber
2.6g
10%
Folate
6µg
43µg
9%
Vitamin B2
0.034mg
0.121mg
7%
Polyunsaturated fat
0.339g
0.978g
4%
Fats
0.86g
2.47g
2%
Calcium
10mg
34mg
2%
Saturated fat
0.163g
0.454g
1%
Protein per 100 calories
8g
4g
N/A
Calories per 10 g protein
125kcal
248kcal
N/A
Weight per 100 calories
250g
29g
N/A
Unsaturated / Saturated Fat ratio
3.9
2.9
N/A
Net carbs
8.84g
71.13g
N/A
Sodium
1mg
2mg
0%
Monounsaturated fat
0.291g
0.344g
0%
Tryptophan
0.057mg
0.176mg
0%
Threonine
0.086mg
0.366mg
0%
Isoleucine
0.114mg
0.533mg
0%
Leucine
0.235mg
0.934mg
0%
Lysine
0.13mg
0.303mg
0%
Methionine
0.057mg
0.221mg
0%
Phenylalanine
0.155mg
0.681mg
0%
Valine
0.165mg
0.594mg
0%
Histidine
0.07mg
0.322mg
0%
Macronutrient Comparison
Macronutrient breakdown side-by-side comparison
1
3%
11%
84%
Protein:
3.21 g
Fats:
0.86 g
Carbs:
11.44 g
Water:
84 g
Other:
0.49 g
4
14%
2%
71%
11%
2%
Protein:
13.68 g
Fats:
2.47 g
Carbs:
71.13 g
Water:
10.94 g
Other:
1.78 g
Contains
more
Water Water
+667.8%
Contains
more
Protein Protein
+326.2%
Contains
more
Fats Fats
+187.2%
Contains
more
Carbs Carbs
+521.8%
Contains
more
Other Other
+263.3%
Fat Type Comparison
Fat type breakdown side-by-side comparison
1
21%
37%
43%
Saturated fat:
Sat. Fat
0.163 g
Monounsaturated fat:
Mono. Fat
0.291 g
Polyunsaturated fat:
Poly. Fat
0.339 g
2
26%
19%
55%
Saturated fat:
Sat. Fat
0.454 g
Monounsaturated fat:
Mono. Fat
0.344 g
Polyunsaturated fat:
Poly. Fat
0.978 g
Contains
less
Sat. Fat Saturated fat
-64.1%
Contains
more
Mono. Fat Monounsaturated fat
+18.2%
Contains
more
Poly. Fat Polyunsaturated fat
+188.5%