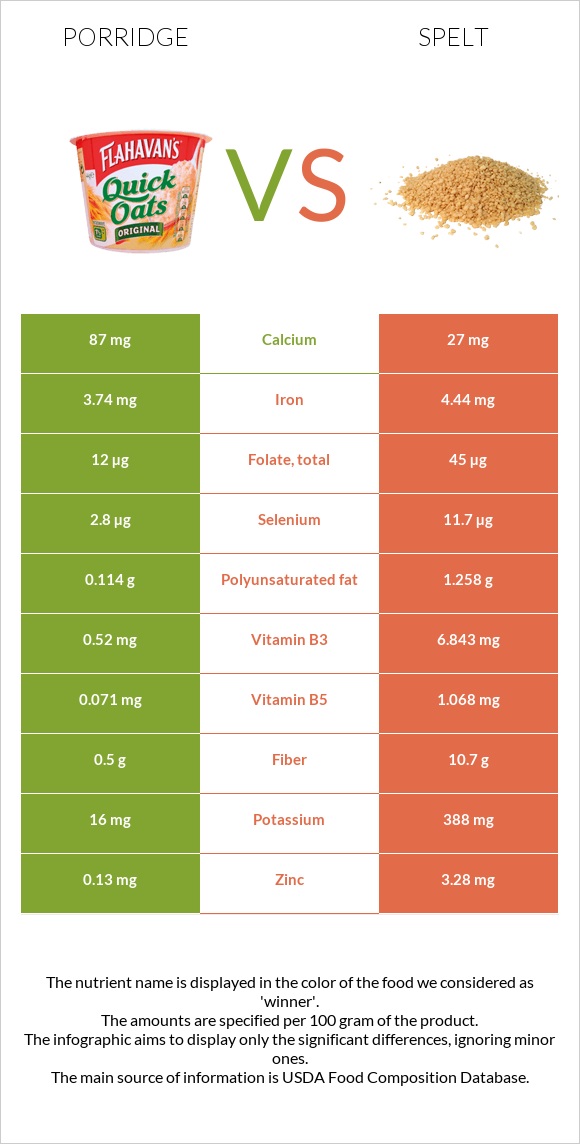
Summary of differences between porridge and spelt The amount of manganese, phosphorus, copper, fiber, vitamin B3, magnesium, zinc, vitamin B1, vitamin B5, and vitamin B6 in spelt is higher than in porridge. Spelt covers your daily need for manganese, 130% more than porridge. These are the specific foods used in this comparison Cereals, CREAM OF WHEAT, regular (10 minute), cooked with water, without salt and Spelt, uncooked .
Infographic
Mineral Comparison
Mineral comparison score is based on the number of minerals by which one or the other food is richer. The "coverage" charts below show how much of the daily needs can be covered by 300 grams of the food.
2
100 g
300 g
1 tbsp - 16g 1 cup (1 serving) - 251g
Magnesium
Magnesium
Calcium
Calcium
Potassium
Potassium
Iron
Iron
Copper
Copper
Zinc
Zinc
Phosphorus
Phosphorus
Sodium
Sodium
Manganese
Manganese
Selenium
Selenium
3.6%
26%
1.4%
140%
13%
3.5%
6.4%
0.78%
0%
15%
8
100 g
300 g
1 cup - 174g
Magnesium
Magnesium
Calcium
Calcium
Potassium
Potassium
Iron
Iron
Copper
Copper
Zinc
Zinc
Phosphorus
Phosphorus
Sodium
Sodium
Manganese
Manganese
Selenium
Selenium
97%
8.1%
34%
167%
170%
89%
172%
1%
389%
64%
Vitamin Comparison
Vitamin comparison score is based on the number of vitamins by which one or the other food is richer. The "coverage" charts below show how much of the daily needs can be covered by 300 grams of the food.
0
100 g
300 g
1 tbsp - 16g 1 cup (1 serving) - 251g
Vitamin C
Vit. C
Vitamin D
Vit. D
Vitamin A
Vit. A
Vitamin E
Vit. E
Vitamin B1
Vit. B1
Vitamin B2
Vit. B2
Vitamin B3
Vit. B3
Vitamin B5
Vit. B5
Vitamin B6
Vit. B6
Vitamin B12
Vit. B12
Vitamin K
Vit. K
Folate
Folate
0%
0%
0%
0.4%
14%
5.8%
9.8%
4.3%
3%
0%
0.25%
9%
8
100 g
300 g
1 cup - 174g
Vitamin C
Vit. C
Vitamin D
Vit. D
Vitamin A
Vit. A
Vitamin E
Vit. E
Vitamin B1
Vit. B1
Vitamin B2
Vit. B2
Vitamin B3
Vit. B3
Vitamin B5
Vit. B5
Vitamin B6
Vit. B6
Vitamin B12
Vit. B12
Vitamin K
Vit. K
Folate
Folate
0%
0%
0%
16%
91%
26%
128%
64%
53%
0%
9%
34%
All nutrients comparison - raw data values
Nutrient
DV% diff.
Manganese
0mg
2.983mg
130%
Phosphorus
15mg
401mg
55%
Copper
0.04mg
0.511mg
52%
Fiber
0.5g
10.7g
41%
Vitamin B3
0.52mg
6.843mg
40%
Magnesium
5mg
136mg
31%
Zinc
0.13mg
3.28mg
29%
Protein
1.44g
14.57g
26%
Vitamin B1
0.055mg
0.364mg
26%
Starch
53.92g
22%
Carbs
10.52g
70.19g
20%
Vitamin B5
0.071mg
1.068mg
20%
Vitamin B6
0.013mg
0.23mg
17%
Selenium
2.8µg
11.7µg
16%
Calories
50kcal
338kcal
14%
Potassium
16mg
388mg
11%
Iron
3.74mg
4.44mg
9%
Folate
12µg
45µg
8%
Polyunsaturated fat
0.114g
1.258g
8%
Vitamin B2
0.025mg
0.113mg
7%
Calcium
87mg
27mg
6%
Vitamin E
0.02mg
0.79mg
5%
Fats
0.21g
2.43g
3%
Vitamin K
0.1µg
3.6µg
3%
Saturated fat
0.033g
0.406g
2%
Monounsaturated fat
0.028g
0.445g
1%
Protein per 100 calories
2.9g
4.3g
N/A
Calories per 10 g protein
347kcal
232kcal
N/A
Weight per 100 calories
200g
30g
N/A
Unsaturated / Saturated Fat ratio
4.3
4.2
N/A
Net carbs
10.02g
59.49g
N/A
Sugar
0.03g
6.82g
N/A
Sodium
6mg
8mg
0%
Tryptophan
0.02mg
0.132mg
0%
Threonine
0.045mg
0.443mg
0%
Isoleucine
0.063mg
0.552mg
0%
Leucine
0.11mg
1.07mg
0%
Lysine
0.037mg
0.409mg
0%
Methionine
0.027mg
0.258mg
0%
Phenylalanine
0.078mg
0.737mg
0%
Valine
0.07mg
0.681mg
0%
Histidine
0.033mg
0.36mg
0%
Fructose
0.24g
0%
Omega-3 - ALA
0.065g
N/A
Macronutrient Comparison
Macronutrient breakdown side-by-side comparison
1
11%
88%
Protein:
1.44 g
Fats:
0.21 g
Carbs:
10.52 g
Water:
87.61 g
Other:
0.22 g
4
15%
2%
70%
11%
2%
Protein:
14.57 g
Fats:
2.43 g
Carbs:
70.19 g
Water:
11.02 g
Other:
1.79 g
Contains
more
Water Water
+695%
Contains
more
Protein Protein
+911.8%
Contains
more
Fats Fats
+1057.1%
Contains
more
Carbs Carbs
+567.2%
Contains
more
Other Other
+713.6%
Fat Type Comparison
Fat type breakdown side-by-side comparison
1
19%
16%
65%
Saturated fat:
Sat. Fat
0.033 g
Monounsaturated fat:
Mono. Fat
0.028 g
Polyunsaturated fat:
Poly. Fat
0.114 g
2
19%
21%
60%
Saturated fat:
Sat. Fat
0.406 g
Monounsaturated fat:
Mono. Fat
0.445 g
Polyunsaturated fat:
Poly. Fat
1.258 g
Contains
less
Sat. Fat Saturated fat
-91.9%
Contains
more
Mono. Fat Monounsaturated fat
+1489.3%
Contains
more
Poly. Fat Polyunsaturated fat
+1003.5%