Rye vs. Wheat — Health Impact and Nutrition Comparison


Summary
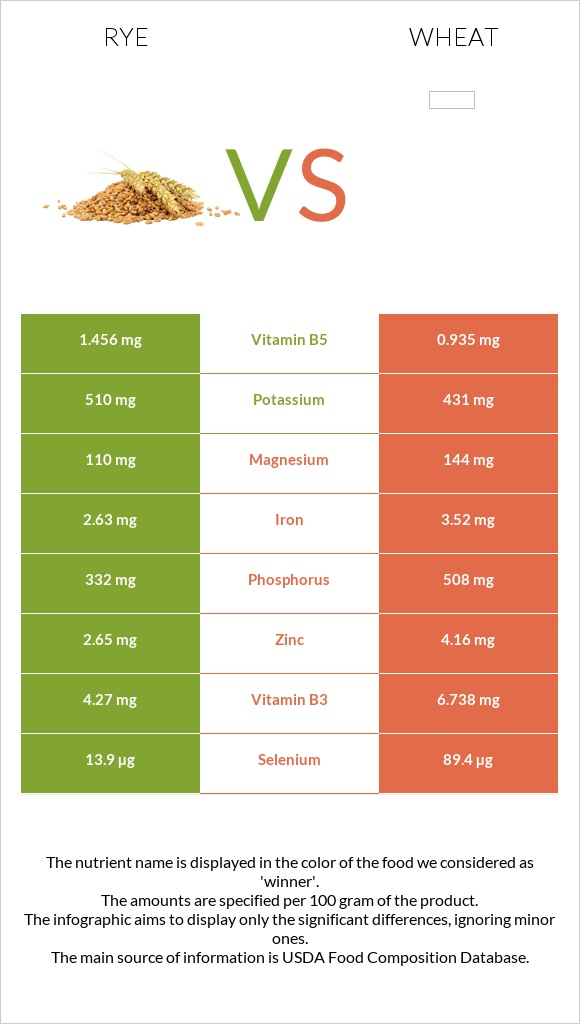
Wheat is higher in calories, protein, and fats, while rye contains more carbohydrates, including dietary fiber. Rye is also more diverse in vitamins, containing vitamins of the B group, as well as vitamin A, vitamin E, and vitamin K. Wheat, on the other hand, is richer in almost all minerals.
Due to its higher dietary fiber content, rye has a lower glycemic index.
As whole grains, both rye and wheat have various beneficial effects on cardiovascular health, diabetes, and cancer.
Introduction
Rye and wheat are two of the most commonly used cereal grains. As these grains are closely related, they may look alike but have distinct characteristics, such as taste and nutritional composition.
In this article, we will compare these two grains to find what they share in common and what sets them apart, with the main focus on nutrition and health.
Classification
Rye and wheat are grass crops grown for their seeds, which are used as cereal grains. These plants are closely related, belonging to the same Triticeae tribe and Poaceae family. The point of the scientific classification at which these two diverge is the genus. Rye (Secale cereale) belongs to the Secale genus, with wheat belonging to the Triticum genus. Multiple species make up the wheat genus; however, the most popular is the common wheat (Triticum aestivum).
Rye and wheat also share this common tribe with barley.
Appearance
These two grains, belonging to the same family and tribe, can look very similar.
Depending on the variety, the appearance of rye and wheat grains can slightly change. However, rye grains are usually more slender and long when compared to wheat grains.
Rye is hard to distinguish from wheat based on color alone. Both can appear in different shades of neutral colors, such as beige and honey.
While the grains look similar in color, the flour made from these grains does not. Rye flour has a darker color, consequently resulting in darker colored rye products, such as rye bread.
Taste and Use
Of course, the taste of these grains is determined greatly by the preparation method, as well as the variety and growing conditions. That said, rye products tend to have a more dense and sour taste, while wheat can taste more bitter or neutral.
Rye and wheat are incredibly versatile. These grains are commonly used to produce flour, bread, beer and vodka, pasta, pastries, among many other foods. Rye and wheat grains can also be consumed whole, as boiled or rolled grains.
Other popular products made from wheat grains are bulgur and semolina.
Growing Conditions
Rye plants are less demanding compared to wheat plants. Rye plants can be grown in temperatures as low as 38°F (3°C) and a pH range of 5 to 7. Wheat, on the other hand, grows in warmer temperatures and the pH range of 6 to 7.
Varieties
There are dozens of varieties of wheat and rye plants being cultivated worldwide. Each variety has a slightly different nutritional composition, appearance, and use.
Wheat is commonly classified into six main groups: hard red winter, hard red spring, soft red winter, soft white, hard white, and durum.
Based on different genetic traits, wheat can be diploid (einkorn), tetraploid (durum, emmer, Khorasan), and hexaploid (common wheat, spelt).
A few of the most common varieties of cereal rye are Aroostook, Brasetto, Elbon, and Hazlet.
Depending on the processing method, these grains can be whole, cracked, or rolled. Whole grains are also called rye berries or wheat berries. The cracked berries have the same nutrition as whole grains, as they are simply cracked into smaller pieces for easier use and quicker preparation. Grain flakes are otherwise known as rolled grains. Rye and wheat are steamed and later rolled and dried to achieve these.
Nutrition
The nutritional information in this section is presented for whole rye grains, durum and Khorasan wheat.
Macronutrients and Calories
Rye and wheat are incredibly dense in nutrients, both containing less than 11% of water.
The average serving size of wheat is one cup, equal to 192g of wheat. One cup of rye weighs a little lighter, making the serving size of rye 169g.
Calories
Like most grains, both wheat and rye are very high in calories. These grains contain nearly the same amount of calories, with wheat containing only one more calorie per every hundred grams.
Protein and Fats
Wheat grains are richer in both protein and fats.
Both of these grains contain high levels of all essential amino acids. Wheat is higher in all of these amino acids, except for lysine, as wheat and rye grains contain a nearly equal amount of lysine.
Wheat is higher than rye in all three forms of fatty acids: saturated, monounsaturated, and polyunsaturated.
Wheat and rye naturally do not contain cholesterol.
Carbohydrates
Rye grains are comparatively richer in carbohydrates.
Both rye and wheat are high in carbohydrates but low in sugars. This is due to the high dietary fiber content. About 90% of all carbohydrate content of these grains is made up of fiber.
Rye contains larger amounts of dietary fiber when compared to wheat. The small content of sugars is made up of sucrose, glucose, and fructose.
Vitamins
Cereal grains are a great source of most B complex vitamins.
Wheat contains more B group vitamins, being richer in vitamin B1, vitamin B3, vitamin B6 and the folate form of vitamin B9.
Rye grains, on the other hand, are more versatile in vitamins, containing more of vitamin B2 and vitamin B6, as well as vitamin A, vitamin K and vitamin E (1).
Both rye and wheat grains completely lack vitamin C, vitamin D, and vitamin B12.
Vitamin Comparison
Contains
more
Vitamin AVitamin A
+∞%
Contains
more
Vitamin EVitamin E
+∞%
Contains
more
Vitamin B2Vitamin B2
+107.4%
Contains
more
Vitamin B5Vitamin B5
+55.7%
Contains
more
Vitamin KVitamin K
+∞%
Contains
more
Vitamin B1Vitamin B1
+32.6%
Contains
more
Vitamin B3Vitamin B3
+57.8%
Contains
more
Vitamin B6Vitamin B6
+42.5%
Contains
more
FolateFolate
+13.2%
Minerals
Rye and wheat grains are very well packed in minerals; however, wheat is richer in most. Wheat grains contain higher levels of iron, calcium, magnesium, copper, zinc, phosphorus, selenium, and manganese.
Nevertheless, rye is richer in potassium and choline.
Rye and wheat contain the same amount of sodium.
Mineral Comparison
Contains
more
PotassiumPotassium
+18.3%
Contains
more
MagnesiumMagnesium
+30.9%
Contains
more
CalciumCalcium
+41.7%
Contains
more
IronIron
+33.8%
Contains
more
CopperCopper
+50.7%
Contains
more
ZincZinc
+57%
Contains
more
PhosphorusPhosphorus
+53%
Contains
more
ManganeseManganese
+16.9%
Contains
more
SeleniumSelenium
+543.2%
Glycemic Index
According to The International Tables of Glycemic Indices, the average glycemic index of whole rye kernels, based on three studies, is 34 (2).
The average of three studies makes the glycemic index of whole-kernel wheat 45. The glycemic index of precooked and cooked durum wheat falls in the range of 50±5 (2).
Both rye and wheat grains tend to fall in the low glycemic index category due to their high dietary fat content. However, the glycemic index of rye grains is lower.
Similarly, the glycemic index of wholemeal wheat bread is 58, while the glycemic index for rye kernel bread is 53 (2).
Acidity
The acidity of rye and wheat grains is very similar. The pH value for whole wheat grains is 5.8, while this value for whole rye grains is 5.9 (3). This shows that both are acidic foods, but wheat is slightly more acidic.
Another way of evaluating the acidity of foods is the potential renal acid load, also known as the PRAL value. This value demonstrates how much acid or base the food produces inside the organism.
The PRAL values for rye and wheat grains have been calculated to be 3.5 and 12.3 accordingly. The higher this number is, the more acidic-forming the food. This means that wheat produces more acid inside the body compared to rye.
Weight Loss & Diets
Cereal grains are very high in calories; however, this is due to their nutrient-dense qualities, which can play an important role in a healthy diet.
Out of these two grains, rye is the better choice for low-calorie, low-fat, or low glycemic index diets, while wheat is the preferred choice on a low-carb diet.
Studies have shown that rye products, as well as whole-grain rye, increase satiety and lower hunger, thus leading to greater weight loss when compared to the same size serving of wheat products or whole wheat grain (4).
Research shows that whole-grain rye, but not whole-grain wheat, lowers body weight and fat mass due to increased satiety, leading to reduced energy intake (5).
Nonetheless, there are studies showing that whole grain intake, including wheat, has an inverse association with body mass index and weight gain (6).
Health Impact
Health Benefits
Cereal grains are full of beneficial qualities when consumed in moderation. In this section, we will look into some of those qualities.
Cardiovascular Health
A study has concluded that rye bread consumption effectively reduces serum total and low-density lipoprotein cholesterol concentrations in men, but not women, with elevated serum cholesterol (7).
Ingestion of rye bread has also been shown to significantly reduce plasma total and low-density lipoprotein cholesterol levels when compared to wheat consumption (8).
One meta-analysis has demonstrated inverse associations between whole grain intake, such as wheat and rye, and total and cause-specific mortality, particularly cardiovascular mortality (9).
In epidemiological cohort studies, there is a consistent, inverse association between dietary whole grain intake and incident cardiovascular disease (10).
Diabetes
Rye and wheat grains both have low glycemic indices, although the glycemic index of rye tends to be lower.
Compared to wheat bread, rye bread demonstrated a preferable absorption pattern and metabolic response (11).
Eleven meta-analyses have concluded that the consumption of whole grains, such as rye and wheat, may prove to be beneficial in the prevention of cardiovascular disease and type 2 diabetes (4).
Regular consumption of whole grains may lower diabetes risk due to an improvement of plasma glucose regulation, postprandial hyperinsulinemia, insulin resistance, and the beneficial effect on body weight (12)
Cancer
Various studies have researched the ability of rye products to decrease the risk of breast cancer (13).
There is strong scientific evidence that the consumption of whole-grain products reduces the risk of colorectal cancer, partially due to the high dietary fiber content (14).
Whole grain intake has also been correlated with a reduced risk of gastric, pancreatic, and endometrial cancers (15)
Downsides and Risks
Gluten Intolerance
Both wheat and rye are rich in a family of proteins called gluten. In some people, consumption of this protein causes adverse effects, such as Celiac disease, non-celiac gluten sensitivity, as well as more rare conditions, including dermatitis herpetiformis and gluten ataxia.
However, gluten is harmless to consume for people who are not gluten intolerant.
References
- https://fdc.nal.usda.gov/fdc-app.html#/food-details/169743/nutrients
- https://academic.oup.com/ajcn/article/114/5/1625/6320814
- http://www.nphsystem.guide/grain_food_values.htm
- https://www.sciencedirect.com/science/article/pii/S0924224418303339
- https://pubmed.ncbi.nlm.nih.gov/28327566/
- https://www.ncbi.nlm.nih.gov/pmc/articles/PMC6627338/
- https://academic.oup.com/jn/article/130/2/164/4686574
- https://onlinelibrary.wiley.com/doi/abs/10.1002/jsfa.3229
- https://www.ahajournals.org/doi/10.1161/CIRCULATIONAHA.115.021101
- https://www.sciencedirect.com/science/article/abs/pii/S0939475307000026
- https://pubmed.ncbi.nlm.nih.gov/2436870/
- https://www.ncbi.nlm.nih.gov/pmc/articles/PMC6163785/
- https://www.ncbi.nlm.nih.gov/pmc/articles/PMC3037245/
- https://www.wcrf.org/dietandcancer/exposures/wholegrains-veg-fruit
- https://pubmed.ncbi.nlm.nih.gov/9589426/

Infographic
All nutrients comparison - raw data values
| Nutrient | |
|
DV% diff. |
| Selenium | 13.9µg | 89.4µg | 137% |
| Fiber | 15.1g | 60% | |
| Phosphorus | 332mg | 508mg | 25% |
| Copper | 0.367mg | 0.553mg | 21% |
| Manganese | 2.577mg | 3.012mg | 19% |
| Vitamin B3 | 4.27mg | 6.738mg | 15% |
| Zinc | 2.65mg | 4.16mg | 14% |
| Iron | 2.63mg | 3.52mg | 11% |
| Vitamin B2 | 0.251mg | 0.121mg | 10% |
| Vitamin B5 | 1.456mg | 0.935mg | 10% |
| Vitamin B6 | 0.294mg | 0.419mg | 10% |
| Vitamin B1 | 0.316mg | 0.419mg | 9% |
| Magnesium | 110mg | 144mg | 8% |
| Protein | 10.34g | 13.68g | 7% |
| Vitamin E | 0.85mg | 6% | |
| Choline | 30.4mg | 6% | |
| Vitamin K | 5.9µg | 5% | |
| Carbs | 75.86g | 71.13g | 2% |
| Potassium | 510mg | 431mg | 2% |
| Fats | 1.63g | 2.47g | 1% |
| Calcium | 24mg | 34mg | 1% |
| Folate | 38µg | 43µg | 1% |
| Saturated fat | 0.197g | 0.454g | 1% |
| Polyunsaturated fat | 0.767g | 0.978g | 1% |
| Calories | 338kcal | 339kcal | 0% |
| Protein per 100 calories | 3.1g | 4g | N/A |
| Calories per 10 g protein | 327kcal | 248kcal | N/A |
| Weight per 100 calories | 30g | 29g | N/A |
| Unsaturated / Saturated Fat ratio | 4.9 | 2.9 | N/A |
| Net carbs | 60.76g | 71.13g | N/A |
| Sugar | 0.98g | N/A | |
| Sodium | 2mg | 2mg | 0% |
| Vitamin A | 1µg | 0µg | 0% |
| Monounsaturated fat | 0.208g | 0.344g | 0% |
| Tryptophan | 0.108mg | 0.176mg | 0% |
| Threonine | 0.289mg | 0.366mg | 0% |
| Isoleucine | 0.208mg | 0.533mg | 0% |
| Leucine | 0.563mg | 0.934mg | 0% |
| Lysine | 0.286mg | 0.303mg | 0% |
| Methionine | 0.153mg | 0.221mg | 0% |
| Phenylalanine | 0.435mg | 0.681mg | 0% |
| Valine | 0.317mg | 0.594mg | 0% |
| Histidine | 0.189mg | 0.322mg | 0% |
| Fructose | 0.11g | 0% |
Macronutrient Comparison
| Contains more ProteinProtein | +32.3% |
| Contains more FatsFats | +51.5% |
| Contains more OtherOther | +13.4% |
Fat Type Comparison
| Contains less Sat. FatSaturated fat | -56.6% |
| Contains more Mono. FatMonounsaturated fat | +65.4% |
| Contains more Poly. FatPolyunsaturated fat | +27.5% |
References
All the values for which the sources are not specified explicitly are taken from FDA’s Food Central. The exact link to the food presented on this page can be found below.
- Rye - https://fdc.nal.usda.gov/fdc-app.html#/food-details/168884/nutrients
- Wheat - https://fdc.nal.usda.gov/fdc-app.html#/food-details/169721/nutrients
All the Daily Values are presented for males aged 31-50, for 2000-calorie diets.