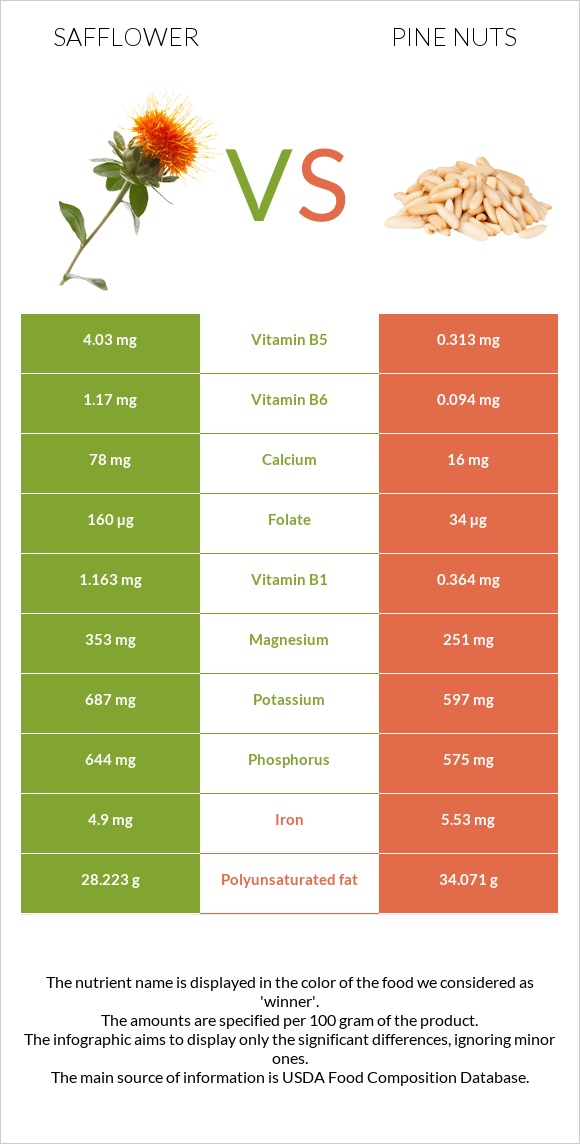
How are safflower and pine nuts different? Safflower is richer in vitamin B6, vitamin B5, vitamin B1, copper, folate, magnesium, and vitamin B2, while pine nuts are higher in manganese, vitamin B3, and zinc. Pine nuts cover your daily need for manganese, 295% more than safflower. Safflower contains 13 times more vitamin B5 than pine nuts. Safflower contains 4.03mg of vitamin B5, while pine nuts contain 0.313mg. Seeds, safflower seed kernels, dried and Nuts, pine nuts, dried types were used in this article.
Infographic
Mineral Comparison
Mineral comparison score is based on the number of minerals by which one or the other food is richer. The "coverage" charts below show how much of the daily needs can be covered by 300 grams of the food.
5
100 g
300 g
1 oz - 28.35g
Magnesium
Magnesium
Calcium
Calcium
Potassium
Potassium
Iron
Iron
Copper
Copper
Zinc
Zinc
Phosphorus
Phosphorus
Sodium
Sodium
Manganese
Manganese
Selenium
Selenium
252%
23%
61%
184%
582%
138%
276%
0.39%
263%
0%
5
100 g
300 g
10 nuts - 1.7g 1 oz (167 kernels) - 28.35g 1 cup - 135g
Magnesium
Magnesium
Calcium
Calcium
Potassium
Potassium
Iron
Iron
Copper
Copper
Zinc
Zinc
Phosphorus
Phosphorus
Sodium
Sodium
Manganese
Manganese
Selenium
Selenium
179%
4.8%
53%
207%
441%
176%
246%
0.26%
1148%
3.8%
Vitamin Comparison
Vitamin comparison score is based on the number of vitamins by which one or the other food is richer. The "coverage" charts below show how much of the daily needs can be covered by 300 grams of the food.
6
100 g
300 g
1 oz - 28.35g
Vitamin C
Vit. C
Vitamin D
Vit. D
Vitamin A
Vit. A
Vitamin E
Vit. E
Vitamin B1
Vit. B1
Vitamin B2
Vit. B2
Vitamin B3
Vit. B3
Vitamin B5
Vit. B5
Vitamin B6
Vit. B6
Vitamin B12
Vit. B12
Vitamin K
Vit. K
Folate
Folate
0%
0%
1%
0%
291%
96%
43%
242%
270%
0%
0%
120%
4
100 g
300 g
10 nuts - 1.7g 1 oz (167 kernels) - 28.35g 1 cup - 135g
Vitamin C
Vit. C
Vitamin D
Vit. D
Vitamin A
Vit. A
Vitamin E
Vit. E
Vitamin B1
Vit. B1
Vitamin B2
Vit. B2
Vitamin B3
Vit. B3
Vitamin B5
Vit. B5
Vitamin B6
Vit. B6
Vitamin B12
Vit. B12
Vitamin K
Vit. K
Folate
Folate
2.7%
0%
0.33%
187%
91%
52%
82%
19%
22%
0%
135%
26%
All nutrients comparison - raw data values
Nutrient
DV% diff.
Manganese
2.014mg
8.802mg
295%
Vitamin B6
1.17mg
0.094mg
83%
Vitamin B5
4.03mg
0.313mg
74%
Vitamin B1
1.163mg
0.364mg
67%
Vitamin E
9.33mg
62%
Copper
1.747mg
1.324mg
47%
Fats
38.45g
68.37g
46%
Vitamin K
53.9µg
45%
Polyunsaturated fat
28.223g
34.071g
39%
Monounsaturated fat
4.848g
18.764g
35%
Folate
160µg
34µg
32%
Magnesium
353mg
251mg
24%
Fiber
3.7g
15%
Vitamin B2
0.415mg
0.227mg
14%
Zinc
5.05mg
6.45mg
13%
Vitamin B3
2.284mg
4.387mg
13%
Phosphorus
644mg
575mg
10%
Choline
55.8mg
10%
Calories
517kcal
673kcal
8%
Iron
4.9mg
5.53mg
8%
Carbs
34.29g
13.08g
7%
Calcium
78mg
16mg
6%
Saturated fat
3.682g
4.899g
6%
Protein
16.18g
13.69g
5%
Potassium
687mg
597mg
3%
Vitamin C
0mg
0.8mg
1%
Starch
1.43g
1%
Selenium
0.7µg
1%
Protein per 100 calories
3.1g
2g
N/A
Calories per 10 g protein
320kcal
492kcal
N/A
Weight per 100 calories
19g
15g
N/A
Unsaturated / Saturated Fat ratio
9
11
N/A
Net carbs
34.29g
9.38g
N/A
Sugar
3.59g
N/A
Sodium
3mg
2mg
0%
Vitamin A
3µg
1µg
0%
Tryptophan
0.183mg
0.107mg
0%
Threonine
0.586mg
0.37mg
0%
Isoleucine
0.717mg
0.542mg
0%
Leucine
1.154mg
0.991mg
0%
Lysine
0.534mg
0.54mg
0%
Methionine
0.284mg
0.259mg
0%
Phenylalanine
0.806mg
0.524mg
0%
Valine
1.025mg
0.687mg
0%
Histidine
0.452mg
0.341mg
0%
Fructose
0.07g
0%
Omega-3 - ALA
0.112g
N/A
Omega-6 - Gamma-linoleic acid
0.052g
N/A
Omega-6 - Eicosadienoic acid
0.404g
N/A
Macronutrient Comparison
Macronutrient breakdown side-by-side comparison
4
16%
38%
34%
6%
5%
Protein:
16.18 g
Fats:
38.45 g
Carbs:
34.29 g
Water:
5.62 g
Other:
5.46 g
1
14%
68%
13%
2%
3%
Protein:
13.69 g
Fats:
68.37 g
Carbs:
13.08 g
Water:
2.28 g
Other:
2.58 g
Contains
more
Protein Protein
+18.2%
Contains
more
Carbs Carbs
+162.2%
Contains
more
Water Water
+146.5%
Contains
more
Other Other
+111.6%
Contains
more
Fats Fats
+77.8%
Fat Type Comparison
Fat type breakdown side-by-side comparison
1
10%
13%
77%
Saturated fat:
Sat. Fat
3.682 g
Monounsaturated fat:
Mono. Fat
4.848 g
Polyunsaturated fat:
Poly. Fat
28.223 g
2
8%
33%
59%
Saturated fat:
Sat. Fat
4.899 g
Monounsaturated fat:
Mono. Fat
18.764 g
Polyunsaturated fat:
Poly. Fat
34.071 g
Contains
less
Sat. Fat Saturated fat
-24.8%
Contains
more
Mono. Fat Monounsaturated fat
+287%
Contains
more
Poly. Fat Polyunsaturated fat
+20.7%