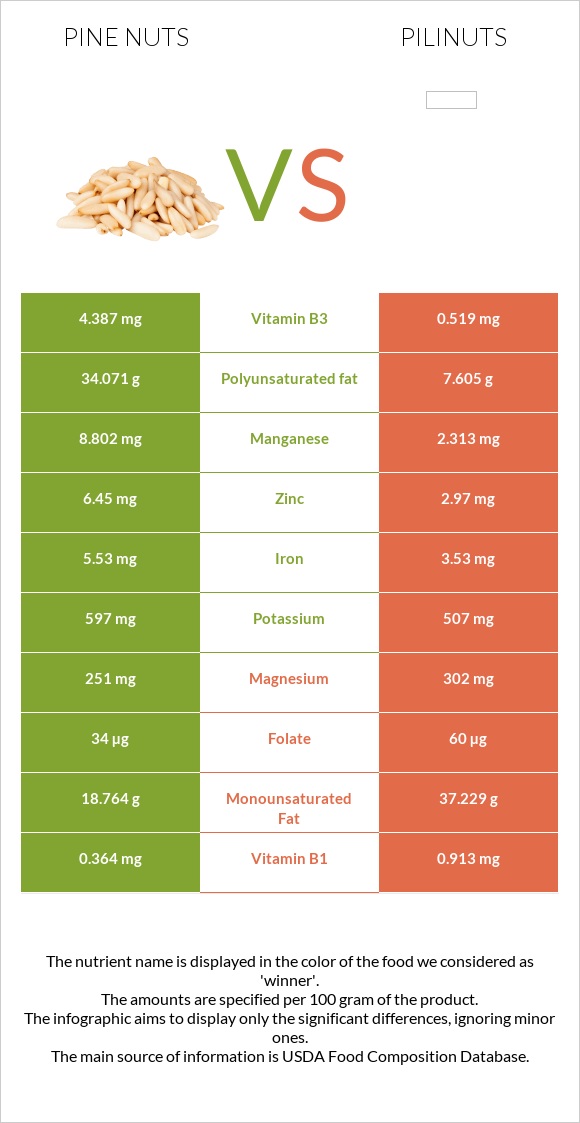
Important differences between pine nuts and pili nuts Pine nuts have more manganese, copper, zinc, iron, vitamin B3, and vitamin B2; however, pili nuts have more vitamin B1, calcium, and magnesium. Pine nuts' daily need coverage for manganese is 282% more. Pine nuts have 8 times more vitamin B3 than pili nuts. Pine nuts have 4.387mg of vitamin B3, while pili nuts have 0.519mg. Pine nuts are lower in saturated fat. The food varieties used in the comparison are Nuts, pine nuts, dried and Nuts, pilinuts, dried .
Infographic
Mineral Comparison
Mineral comparison score is based on the number of minerals by which one or the other food is richer. The "coverage" charts below show how much of the daily needs can be covered by 300 grams of the food.
7
100 g
300 g
10 nuts - 1.7g 1 oz (167 kernels) - 28.35g 1 cup - 135g
Magnesium
Magnesium
Calcium
Calcium
Potassium
Potassium
Iron
Iron
Copper
Copper
Zinc
Zinc
Phosphorus
Phosphorus
Sodium
Sodium
Manganese
Manganese
Selenium
Selenium
179%
4.8%
53%
207%
441%
176%
246%
0.26%
1148%
3.8%
2
100 g
300 g
1 oz (15 kernels) - 28.35g 1 cup - 120g
Magnesium
Magnesium
Calcium
Calcium
Potassium
Potassium
Iron
Iron
Copper
Copper
Zinc
Zinc
Phosphorus
Phosphorus
Sodium
Sodium
Manganese
Manganese
Selenium
Selenium
216%
44%
45%
132%
319%
81%
246%
0.39%
302%
0%
Vitamin Comparison
Vitamin comparison score is based on the number of vitamins by which one or the other food is richer. The "coverage" charts below show how much of the daily needs can be covered by 300 grams of the food.
5
100 g
300 g
10 nuts - 1.7g 1 oz (167 kernels) - 28.35g 1 cup - 135g
Vitamin C
Vit. C
Vitamin D
Vit. D
Vitamin A
Vit. A
Vitamin E
Vit. E
Vitamin B1
Vit. B1
Vitamin B2
Vit. B2
Vitamin B3
Vit. B3
Vitamin B5
Vit. B5
Vitamin B6
Vit. B6
Vitamin B12
Vit. B12
Vitamin K
Vit. K
Folate
Folate
2.7%
0%
0.33%
187%
91%
52%
82%
19%
22%
0%
135%
26%
5
100 g
300 g
1 oz (15 kernels) - 28.35g 1 cup - 120g
Vitamin C
Vit. C
Vitamin D
Vit. D
Vitamin A
Vit. A
Vitamin E
Vit. E
Vitamin B1
Vit. B1
Vitamin B2
Vit. B2
Vitamin B3
Vit. B3
Vitamin B5
Vit. B5
Vitamin B6
Vit. B6
Vitamin B12
Vit. B12
Vitamin K
Vit. K
Folate
Folate
2%
0%
0.67%
0%
228%
21%
9.7%
29%
27%
0%
0%
45%
All nutrients comparison - raw data values
Nutrient
DV% diff.
Manganese
8.802mg
2.313mg
282%
Polyunsaturated fat
34.071g
7.605g
176%
Saturated fat
4.899g
31.184g
119%
Vitamin E
9.33mg
62%
Vitamin B1
0.364mg
0.913mg
46%
Monounsaturated fat
18.764g
37.229g
46%
Vitamin K
53.9µg
45%
Copper
1.324mg
0.958mg
41%
Zinc
6.45mg
2.97mg
32%
Iron
5.53mg
3.53mg
25%
Vitamin B3
4.387mg
0.519mg
24%
Fats
68.37g
79.55g
17%
Fiber
3.7g
15%
Calcium
16mg
145mg
13%
Magnesium
251mg
302mg
12%
Vitamin B2
0.227mg
0.093mg
10%
Choline
55.8mg
10%
Folate
34µg
60µg
7%
Protein
13.69g
10.8g
6%
Carbs
13.08g
3.98g
3%
Potassium
597mg
507mg
3%
Vitamin B5
0.313mg
0.479mg
3%
Calories
673kcal
719kcal
2%
Vitamin B6
0.094mg
0.115mg
2%
Starch
1.43g
1%
Selenium
0.7µg
1%
Protein per 100 calories
2g
1.5g
N/A
Calories per 10 g protein
492kcal
666kcal
N/A
Weight per 100 calories
15g
14g
N/A
Unsaturated / Saturated Fat ratio
11
1.4
N/A
Vitamin C
0.8mg
0.6mg
0%
Net carbs
9.38g
3.98g
N/A
Sugar
3.59g
N/A
Phosphorus
575mg
575mg
0%
Sodium
2mg
3mg
0%
Vitamin A
1µg
2µg
0%
Tryptophan
0.107mg
0.189mg
0%
Threonine
0.37mg
0.407mg
0%
Isoleucine
0.542mg
0.483mg
0%
Leucine
0.991mg
0.89mg
0%
Lysine
0.54mg
0.369mg
0%
Methionine
0.259mg
0.395mg
0%
Phenylalanine
0.524mg
0.497mg
0%
Valine
0.687mg
0.701mg
0%
Histidine
0.341mg
0.255mg
0%
Fructose
0.07g
0%
Omega-3 - ALA
0.112g
N/A
Omega-6 - Gamma-linoleic acid
0.052g
N/A
Omega-6 - Eicosadienoic acid
0.404g
N/A
Macronutrient Comparison
Macronutrient breakdown side-by-side comparison
2
14%
68%
13%
2%
3%
Protein:
13.69 g
Fats:
68.37 g
Carbs:
13.08 g
Water:
2.28 g
Other:
2.58 g
3
11%
80%
4%
3%
3%
Protein:
10.8 g
Fats:
79.55 g
Carbs:
3.98 g
Water:
2.77 g
Other:
2.9 g
Contains
more
Protein Protein
+26.8%
Contains
more
Carbs Carbs
+228.6%
Contains
more
Fats Fats
+16.4%
Contains
more
Water Water
+21.5%
Contains
more
Other Other
+12.4%
Fat Type Comparison
Fat type breakdown side-by-side comparison
2
8%
33%
59%
Saturated fat:
Sat. Fat
4.899 g
Monounsaturated fat:
Mono. Fat
18.764 g
Polyunsaturated fat:
Poly. Fat
34.071 g
1
41%
49%
10%
Saturated fat:
Sat. Fat
31.184 g
Monounsaturated fat:
Mono. Fat
37.229 g
Polyunsaturated fat:
Poly. Fat
7.605 g
Contains
less
Sat. Fat Saturated fat
-84.3%
Contains
more
Poly. Fat Polyunsaturated fat
+348%
Contains
more
Mono. Fat Monounsaturated fat
+98.4%