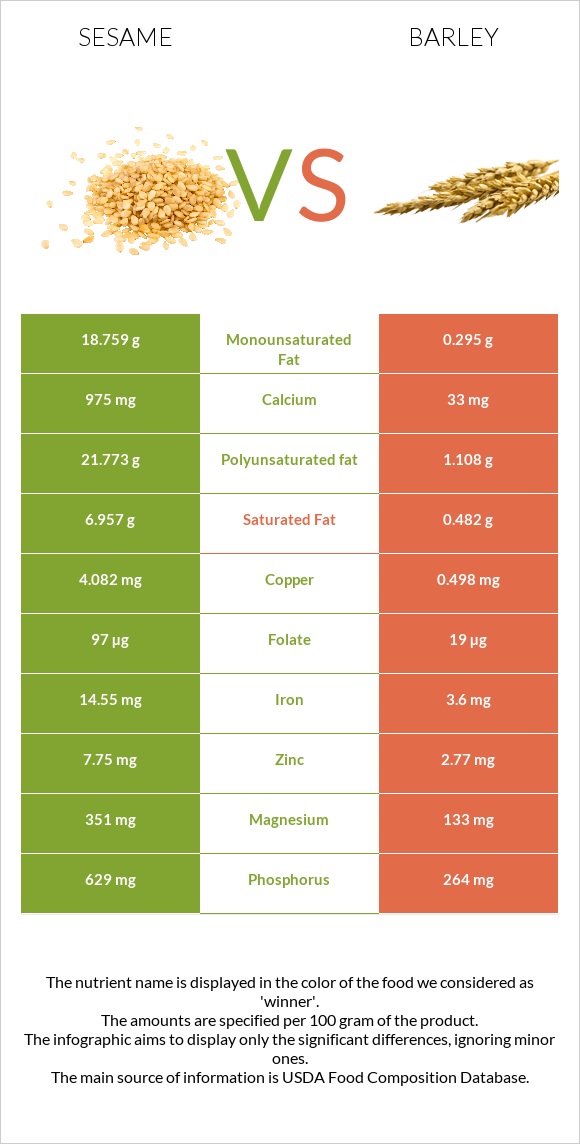
What are the differences between sesame and barley? Sesame is higher in copper, iron, calcium, phosphorus, magnesium, zinc, vitamin B6, and manganese, yet barley is higher in fiber. Sesame's daily need coverage for copper is 398% more. Sesame has 30 times more calcium than barley. While sesame has 975mg of calcium, barley has only 33mg. The amount of saturated fat in barley is lower. We used Seeds, sesame seeds, whole, dried and Barley, hulled types in this article.
Infographic
Mineral Comparison
Mineral comparison score is based on the number of minerals by which one or the other food is richer. The "coverage" charts below show how much of the daily needs can be covered by 300 grams of the food.
7
100 g
300 g
1 tbsp - 9g 1 cup - 144g
Magnesium
Magnesium
Calcium
Calcium
Potassium
Potassium
Iron
Iron
Copper
Copper
Zinc
Zinc
Phosphorus
Phosphorus
Sodium
Sodium
Manganese
Manganese
Selenium
Selenium
251%
293%
41%
546%
1361%
211%
270%
1.4%
321%
188%
0
100 g
300 g
1 cup - 184g
Magnesium
Magnesium
Calcium
Calcium
Potassium
Potassium
Iron
Iron
Copper
Copper
Zinc
Zinc
Phosphorus
Phosphorus
Sodium
Sodium
Manganese
Manganese
Selenium
Selenium
95%
9.9%
40%
135%
166%
76%
113%
1.6%
253%
206%
Vitamin Comparison
Vitamin comparison score is based on the number of vitamins by which one or the other food is richer. The "coverage" charts below show how much of the daily needs can be covered by 300 grams of the food.
3
100 g
300 g
1 tbsp - 9g 1 cup - 144g
Vitamin C
Vit. C
Vitamin D
Vit. D
Vitamin A
Vit. A
Vitamin E
Vit. E
Vitamin B1
Vit. B1
Vitamin B2
Vit. B2
Vitamin B3
Vit. B3
Vitamin B5
Vit. B5
Vitamin B6
Vit. B6
Vitamin B12
Vit. B12
Vitamin K
Vit. K
Folate
Folate
0%
0%
0%
5%
198%
57%
85%
3%
182%
0%
0%
73%
5
100 g
300 g
1 cup - 184g
Vitamin C
Vit. C
Vitamin D
Vit. D
Vitamin A
Vit. A
Vitamin E
Vit. E
Vitamin B1
Vit. B1
Vitamin B2
Vit. B2
Vitamin B3
Vit. B3
Vitamin B5
Vit. B5
Vitamin B6
Vit. B6
Vitamin B12
Vit. B12
Vitamin K
Vit. K
Folate
Folate
0%
0%
0.33%
11%
162%
66%
86%
17%
73%
0%
5.5%
14%
All nutrients comparison - raw data values
Nutrient
DV% diff.
Copper
4.082mg
0.498mg
398%
Polyunsaturated fat
21.773g
1.108g
138%
Iron
14.55mg
3.6mg
137%
Calcium
975mg
33mg
94%
Fats
49.67g
2.3g
73%
Magnesium
351mg
133mg
52%
Phosphorus
629mg
264mg
52%
Monounsaturated fat
18.759g
0.295g
46%
Zinc
7.75mg
2.77mg
45%
Vitamin B6
0.79mg
0.318mg
36%
Saturated fat
6.957g
0.482g
29%
Fiber
11.8g
17.3g
22%
Manganese
2.46mg
1.943mg
22%
Folate
97µg
19µg
20%
Carbs
23.45g
73.48g
17%
Vitamin B1
0.791mg
0.646mg
12%
Calories
573kcal
354kcal
11%
Protein
17.73g
12.48g
11%
Selenium
34.4µg
37.7µg
6%
Vitamin B5
0.05mg
0.282mg
5%
Choline
25.6mg
5%
Vitamin B2
0.247mg
0.285mg
3%
Vitamin E
0.25mg
0.57mg
2%
Vitamin K
0µg
2.2µg
2%
Vitamin B3
4.515mg
4.604mg
1%
Protein per 100 calories
3.1g
3.5g
N/A
Calories per 10 g protein
323kcal
284kcal
N/A
Weight per 100 calories
17g
28g
N/A
Unsaturated / Saturated Fat ratio
5.8
2.9
N/A
Net carbs
11.65g
56.18g
N/A
Potassium
468mg
452mg
0%
Sugar
0.3g
0.8g
N/A
Sodium
11mg
12mg
0%
Vitamin A
0µg
1µg
0%
Tryptophan
0.388mg
0.208mg
0%
Threonine
0.736mg
0.424mg
0%
Isoleucine
0.763mg
0.456mg
0%
Leucine
1.358mg
0.848mg
0%
Lysine
0.569mg
0.465mg
0%
Methionine
0.586mg
0.24mg
0%
Phenylalanine
0.94mg
0.7mg
0%
Valine
0.99mg
0.612mg
0%
Histidine
0.522mg
0.281mg
0%
Macronutrient Comparison
Macronutrient breakdown side-by-side comparison
3
18%
50%
23%
5%
4%
Protein:
17.73 g
Fats:
49.67 g
Carbs:
23.45 g
Water:
4.69 g
Other:
4.46 g
2
12%
2%
73%
9%
2%
Protein:
12.48 g
Fats:
2.3 g
Carbs:
73.48 g
Water:
9.44 g
Other:
2.3 g
Contains
more
Protein Protein
+42.1%
Contains
more
Fats Fats
+2059.6%
Contains
more
Other Other
+93.9%
Contains
more
Carbs Carbs
+213.3%
Contains
more
Water Water
+101.3%
Fat Type Comparison
Fat type breakdown side-by-side comparison
2
15%
40%
46%
Saturated fat:
Sat. Fat
6.957 g
Monounsaturated fat:
Mono. Fat
18.759 g
Polyunsaturated fat:
Poly. Fat
21.773 g
1
26%
16%
59%
Saturated fat:
Sat. Fat
0.482 g
Monounsaturated fat:
Mono. Fat
0.295 g
Polyunsaturated fat:
Poly. Fat
1.108 g
Contains
more
Mono. Fat Monounsaturated fat
+6259%
Contains
more
Poly. Fat Polyunsaturated fat
+1865.1%
Contains
less
Sat. Fat Saturated fat
-93.1%