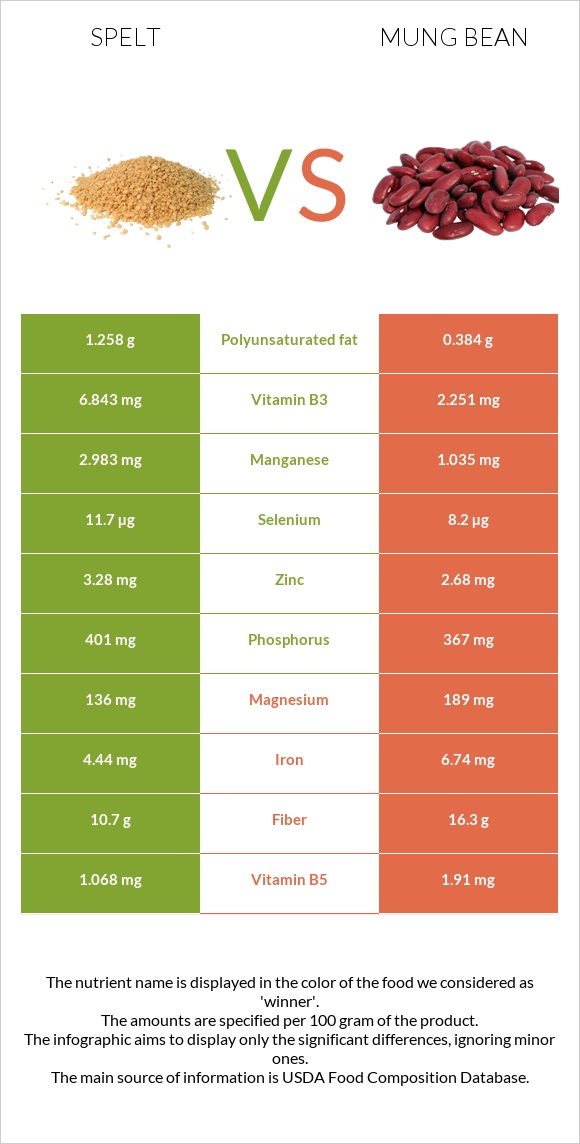
Differences between spelt and mung beans Mung beans are higher than spelt in folate, copper, iron, fiber, vitamin B1, magnesium, potassium, phosphorus, vitamin B6, and vitamin B2. Mung beans' daily need coverage for folate is 153% higher. Mung beans have a lower glycemic index (31) than spelt (63). The food types used in this comparison are Spelt, cooked and Mung beans, mature seeds, raw .
Infographic
Mineral Comparison
Mineral comparison score is based on the number of minerals by which one or the other food is richer. The "coverage" charts below show how much of the daily needs can be covered by 300 grams of the food.
1
100 g
300 g
1 cup - 194g
Magnesium
Magnesium
Calcium
Calcium
Potassium
Potassium
Iron
Iron
Copper
Copper
Zinc
Zinc
Phosphorus
Phosphorus
Sodium
Sodium
Manganese
Manganese
Selenium
Selenium
35%
3%
13%
63%
72%
34%
64%
0.65%
142%
22%
8
100 g
300 g
1 tbsp - 13g 1 cup - 207g
Magnesium
Magnesium
Calcium
Calcium
Potassium
Potassium
Iron
Iron
Copper
Copper
Zinc
Zinc
Phosphorus
Phosphorus
Sodium
Sodium
Manganese
Manganese
Selenium
Selenium
135%
40%
110%
253%
314%
73%
157%
2%
135%
45%
Vitamin Comparison
Vitamin comparison score is based on the number of vitamins by which one or the other food is richer. The "coverage" charts below show how much of the daily needs can be covered by 300 grams of the food.
1
100 g
300 g
1 cup - 194g
Vitamin C
Vit. C
Vitamin D
Vit. D
Vitamin A
Vit. A
Vitamin E
Vit. E
Vitamin B1
Vit. B1
Vitamin B2
Vit. B2
Vitamin B3
Vit. B3
Vitamin B5
Vit. B5
Vitamin B6
Vit. B6
Vitamin B12
Vit. B12
Vitamin K
Vit. K
Folate
Folate
0%
0%
0%
5.2%
26%
6.9%
48%
0%
18%
0%
0%
9.8%
9
100 g
300 g
1 tbsp - 13g 1 cup - 207g
Vitamin C
Vit. C
Vitamin D
Vit. D
Vitamin A
Vit. A
Vitamin E
Vit. E
Vitamin B1
Vit. B1
Vitamin B2
Vit. B2
Vitamin B3
Vit. B3
Vitamin B5
Vit. B5
Vitamin B6
Vit. B6
Vitamin B12
Vit. B12
Vitamin K
Vit. K
Folate
Folate
16%
0%
2%
10%
155%
54%
42%
115%
88%
0%
23%
469%
All nutrients comparison - raw data values
Nutrient
DV% diff.
Folate
13µg
625µg
153%
Copper
0.215mg
0.941mg
81%
Iron
1.67mg
6.74mg
63%
Fiber
3.9g
16.3g
50%
Vitamin B1
0.103mg
0.621mg
43%
Vitamin B5
1.91mg
38%
Protein
5.5g
23.86g
37%
Magnesium
49mg
189mg
33%
Potassium
143mg
1246mg
32%
Phosphorus
150mg
367mg
31%
Vitamin B6
0.08mg
0.382mg
23%
Choline
97.9mg
18%
Vitamin B2
0.03mg
0.233mg
16%
Zinc
1.25mg
2.68mg
13%
Carbs
26.44g
62.62g
12%
Calcium
10mg
132mg
12%
Calories
127kcal
347kcal
11%
Starch
19.57g
8%
Selenium
4µg
8.2µg
8%
Vitamin K
9µg
8%
Vitamin C
0mg
4.8mg
5%
Polyunsaturated fat
0.384g
3%
Vitamin E
0.26mg
0.51mg
2%
Manganese
1.091mg
1.035mg
2%
Vitamin B3
2.57mg
2.251mg
2%
Saturated fat
0.348g
2%
Vitamin A
0µg
6µg
1%
Protein per 100 calories
4.3g
6.9g
N/A
Calories per 10 g protein
231kcal
145kcal
N/A
Weight per 100 calories
79g
29g
N/A
Fats
0.85g
1.15g
0%
Net carbs
22.54g
46.32g
N/A
Sugar
6.6g
N/A
Sodium
5mg
15mg
0%
Monounsaturated fat
0.161g
0%
Tryptophan
0.26mg
0%
Threonine
0.782mg
0%
Isoleucine
1.008mg
0%
Leucine
1.847mg
0%
Lysine
1.664mg
0%
Methionine
0.286mg
0%
Phenylalanine
1.443mg
0%
Valine
1.237mg
0%
Histidine
0.695mg
0%
Macronutrient Comparison
Macronutrient breakdown side-by-side comparison
1
6%
26%
67%
Protein:
5.5 g
Fats:
0.85 g
Carbs:
26.44 g
Water:
66.56 g
Other:
0.65 g
4
24%
63%
9%
3%
Protein:
23.86 g
Fats:
1.15 g
Carbs:
62.62 g
Water:
9.05 g
Other:
3.32 g
Contains
more
Water Water
+635.5%
Contains
more
Protein Protein
+333.8%
Contains
more
Fats Fats
+35.3%
Contains
more
Carbs Carbs
+136.8%
Contains
more
Other Other
+410.8%