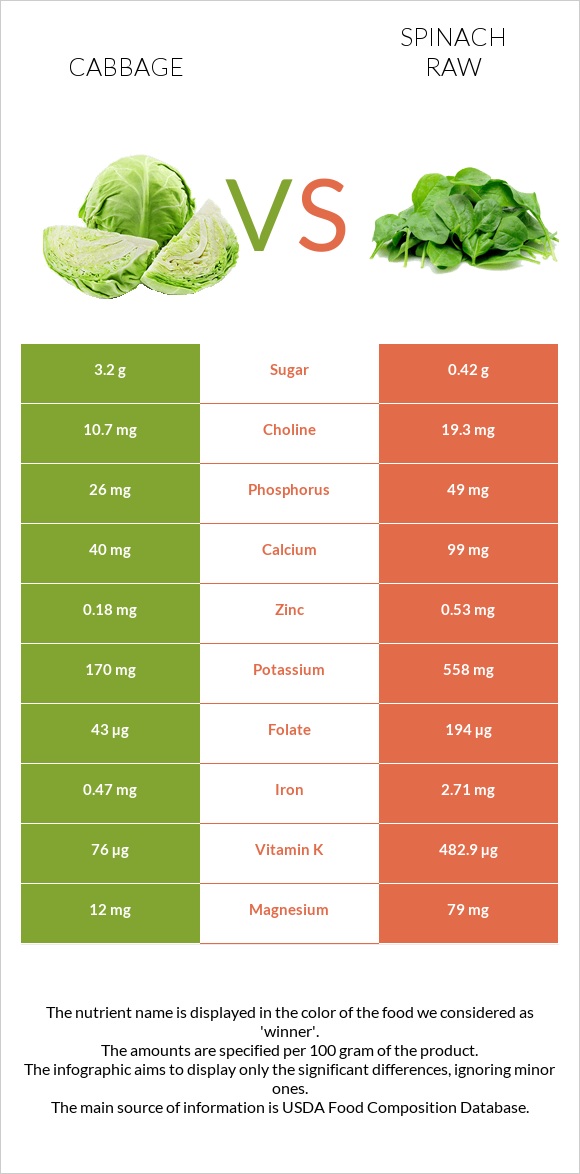
Cabbage vs. Spinach — Nutrition Comparison and Health Impact


Summary
Cabbage is nearly 2 times higher in carbohydrates, mostly due to net carbs. Spinach is relatively higher in protein.
Spinach is a better source of most minerals and vitamins, providing 7 times more copper and magnesium, 3 times more potassium, 96 times more vitamin A, and 14 times more vitamin E.
Introduction
Being members of different plant families, cabbage and spinach have a lot of differences. While these vegetables are packed with vitamins and minerals, spinach and cabbage differ in nutrient content. This article will discuss the general and nutritional differences, along with the health impacts of raw cabbage and raw spinach (1, 2).
Taste and Appearance
Cabbage belongs to the genus Brassica and can come in red, white, green, and purplish colors. It usually has a peppery taste but a sweet flavor when cooked. Cabbage is native to Western Europe.
Spinach comes from southwest Asia. It belongs to the Chenopodiaceae family. Spinach leaves are considerably smaller compared to cabbage leaves. They are usually green. Spinach tends to have a bitter taste.
Nutrition
The nutritional infographics below are presented for 100g servings of raw cabbage and lettuce.
Macronutrients
Macronutrient Comparison
Contains
more
CarbsCarbs
+59.8%
Contains
more
ProteinProtein
+123.4%
Contains
more
FatsFats
+290%
Contains
more
OtherOther
+168.8%
Carbs
Cabbage has more carbs than spinach. Cabbage has 5.8g of carbohydrates per 100g, while spinach has 3.63g. Furthermore, spinach has almost 8 times less sugar than cabbage. Spinach also contains nearly 15 times less glucose and 10 times less fructose.
Carbohydrate type comparison
Contains
more
SucroseSucrose
+14.3%
Contains
more
GlucoseGlucose
+1418.2%
Contains
more
FructoseFructose
+866.7%
Contains
more
MaltoseMaltose
+∞%
Contains
more
GalactoseGalactose
+∞%
Dietary Fiber
Cabbage and spinach provide nearly the same amount of fiber. Cabbage is usually higher in soluble fiber, while spinach contains more insoluble fiber.
Net Carbs
Net carbs are the carbohydrates in food used to synthesize energy. Subtract the amount of fiber from the total carbs in the food to get the net carb amount.
Cabbage provides 5.8 grams of carbs and 2.5 grams of fiber. On the other hand, spinach provides 3.63 grams of carbohydrates and 2.2 grams of fiber per 100g serving. Cabbage has 3.3 grams of net carbs, whereas spinach has 1.43 grams. Hence, spinach has a lower net carb content.
Proteins
Vegetables are generally not considered protein sources, but they contain some amounts of proteins. Spinach provides over 2 times more protein than cabbage. It contains 2.86g per 100g, compared to 1.28g in cabbage.
Fats
Fats are not found in cabbage or spinach in considerable quantities. Cabbage has 0.1 grams of fat per 100 grams of vegetable, whereas spinach has 0.39 grams.
The two vegetables do not contain a significant amount.
Fat Type Comparison
Contains
less
Sat. FatSaturated fat
-46%
Contains
more
Mono. FatMonounsaturated fat
+70%
Contains
more
Poly. FatPolyunsaturated fat
+870.6%
Calories
Cabbage and spinach have almost similar amounts of calories, both being very low-calorie foods. However, cabbage has 25 calories per 100g of vegetable, compared to 23 for spinach.
Vitamins
Vitamins are abundant in vegetables such as cabbage and spinach.
Spinach is a better source of most vitamins. Spinach offers significantly more vitamin A than cabbage, with 9377IU per 100g compared to 98IU in cabbage. It contains almost 14 times more vitamin E and 4 times more vitamin B9 or folate.
Spinach is also richer in vitamins K, B1, B2, B3, and B6.
That being said, cabbage is 3 times higher in vitamin B5 and somewhat richer in vitamin C.
For more detailed information, check the vitamin comparison chart below.
Vitamin Comparison
Contains
more
Vitamin CVitamin C
+30.2%
Contains
more
Vitamin B5Vitamin B5
+226.2%
Contains
more
Vitamin AVitamin A
+9280%
Contains
more
Vitamin EVitamin E
+1253.3%
Contains
more
Vitamin B1Vitamin B1
+27.9%
Contains
more
Vitamin B2Vitamin B2
+372.5%
Contains
more
Vitamin B3Vitamin B3
+209.4%
Contains
more
Vitamin B6Vitamin B6
+57.3%
Contains
more
Vitamin KVitamin K
+535.4%
Contains
more
FolateFolate
+351.2%
A 100g serving of spinach covers the daily need for vitamin A by 188% and for vitamin K by 402%. At the same time, the same serving of cabbage provides 41% of the daily required vitamin C amount.
Minerals
Spinach is the absolute winner in this section.
Spinach provides 7 times more copper and magnesium, 6 times more iron and manganese, and 3 times more potassium. Spinach is also richer in selenium, calcium, zinc, and phosphorus.
However, cabbage contains almost 2 times less sodium.
Mineral Comparison
Contains
less
SodiumSodium
-77.2%
Contains
more
MagnesiumMagnesium
+558.3%
Contains
more
CalciumCalcium
+147.5%
Contains
more
PotassiumPotassium
+228.2%
Contains
more
IronIron
+476.6%
Contains
more
CopperCopper
+584.2%
Contains
more
ZincZinc
+194.4%
Contains
more
PhosphorusPhosphorus
+88.5%
Contains
more
ManganeseManganese
+460.6%
Contains
more
SeleniumSelenium
+233.3%
Health impact
Blood Pressure Management
High blood pressure is a significant risk factor for stroke and heart disease. Cabbage and spinach can be beneficial for blood pressure management.
Because potassium lessens the effects of sodium, foods high in potassium can be important for treating high blood pressure. The more potassium is consumed, the more salt is lost through the urine. Additionally, potassium helps to reduce blood vessel wall tension, which further lowers blood pressure (3).
In otherwise healthy persons with blood pressure over 120/80 mmHg, increasing potassium through diet is advised (3).
Cabbage, especially the red variety of it, is an excellent source of potassium and may help keep blood pressure in a healthy range. However, spinach falls in the top 11% of foods as a source of potassium, providing 16% of the daily needed value for this mineral per 100g.
Spinach consumption has shown blood pressure-lowering properties (4). This is also due to the high amounts of nitrate contained in spinach (5).
Antioxidants
Harmful free oxygen radicals can cause oxidative stress and harm cells and tissues. As a result, oxidative stress may cause cardiovascular disease, obesity, and Alzheimer’s disease (7, 8). Antioxidants are chemicals that help to neutralize this effect (6). Cabbage and spinach are both high in antioxidants. These two vegetables play different roles in the organism's antioxidant defense.
Spinach consumption is linked with DNA stabilization during oxidative stress (9). This is due to the carotenoid or vitamin A content of spinach (10).
Cabbage is high in vitamin C, which is a potent antioxidant that can protect the organism against heart disease and some cancers (11, 12).
References
- https://fdc.nal.usda.gov/fdc-app.html#/food-details/169975/nutrients
- https://fdc.nal.usda.gov/fdc-app.html#/food-details/168462/nutrients
- https://www.heart.org/en/health-topics/high-blood-pressure/changes-you-can-make-to-manage-high-blood-pressure/how-potassium-can-help-control-high-blood-pressure
- https://pubmed.ncbi.nlm.nih.gov/22019438/
- https://www.sciencedirect.com/science/article/abs/pii/S0271531715001359
- https://www.ncbi.nlm.nih.gov/pmc/articles/PMC2684512/
- https://pubmed.ncbi.nlm.nih.gov/28230726/
- https://www.ncbi.nlm.nih.gov/pmc/articles/PMC4307252/
- https://pubmed.ncbi.nlm.nih.gov/21384253/
- https://pubmed.ncbi.nlm.nih.gov/12111045/
- https://pubmed.ncbi.nlm.nih.gov/18277182/
- https://www.ncbi.nlm.nih.gov/pmc/articles/PMC4559762/

Infographic
All nutrients comparison - raw data values
| Nutrient | |
|
DV% diff. |
| Vitamin K | 76µg | 482.9µg | 339% |
| Vitamin A | 5µg | 469µg | 52% |
| Folate | 43µg | 194µg | 38% |
| Manganese | 0.16mg | 0.897mg | 32% |
| Iron | 0.47mg | 2.71mg | 28% |
| Magnesium | 12mg | 79mg | 16% |
| Vitamin E | 0.15mg | 2.03mg | 13% |
| Copper | 0.019mg | 0.13mg | 12% |
| Potassium | 170mg | 558mg | 11% |
| Vitamin B2 | 0.04mg | 0.189mg | 11% |
| Vitamin C | 36.6mg | 28.1mg | 9% |
| Calcium | 40mg | 99mg | 6% |
| Vitamin B6 | 0.124mg | 0.195mg | 5% |
| Protein | 1.28g | 2.86g | 3% |
| Zinc | 0.18mg | 0.53mg | 3% |
| Phosphorus | 26mg | 49mg | 3% |
| Sodium | 18mg | 79mg | 3% |
| Vitamin B3 | 0.234mg | 0.724mg | 3% |
| Vitamin B5 | 0.212mg | 0.065mg | 3% |
| Choline | 10.7mg | 19.3mg | 2% |
| Fructose | 1.45g | 0.15g | 2% |
| Carbs | 5.8g | 3.63g | 1% |
| Fiber | 2.5g | 2.2g | 1% |
| Selenium | 0.3µg | 1µg | 1% |
| Vitamin B1 | 0.061mg | 0.078mg | 1% |
| Polyunsaturated fat | 0.017g | 0.165g | 1% |
| Calories | 25kcal | 23kcal | 0% |
| Fats | 0.1g | 0.39g | 0% |
| Net carbs | 3.3g | 1.43g | N/A |
| Sugar | 3.2g | 0.42g | N/A |
| Saturated fat | 0.034g | 0.063g | 0% |
| Monounsaturated fat | 0.017g | 0.01g | 0% |
| Tryptophan | 0.011mg | 0.039mg | 0% |
| Threonine | 0.035mg | 0.122mg | 0% |
| Isoleucine | 0.03mg | 0.147mg | 0% |
| Leucine | 0.041mg | 0.223mg | 0% |
| Lysine | 0.044mg | 0.174mg | 0% |
| Methionine | 0.012mg | 0.053mg | 0% |
| Phenylalanine | 0.032mg | 0.129mg | 0% |
| Valine | 0.042mg | 0.161mg | 0% |
| Histidine | 0.022mg | 0.064mg | 0% |
References
All the values for which the sources are not specified explicitly are taken from FDA’s Food Central. The exact link to the food presented on this page can be found below.
- Cabbage - https://fdc.nal.usda.gov/fdc-app.html#/food-details/169975/nutrients
- Spinach raw - https://fdc.nal.usda.gov/fdc-app.html#/food-details/168462/nutrients
All the Daily Values are presented for males aged 31-50, for 2000-calorie diets.