Cabbage nutrition: calories, carbs, GI, protein, fiber, fats
Cabbage, raw
*all the values are displayed for the amount of 100 grams
Medically reviewed by Elen Khachatrian

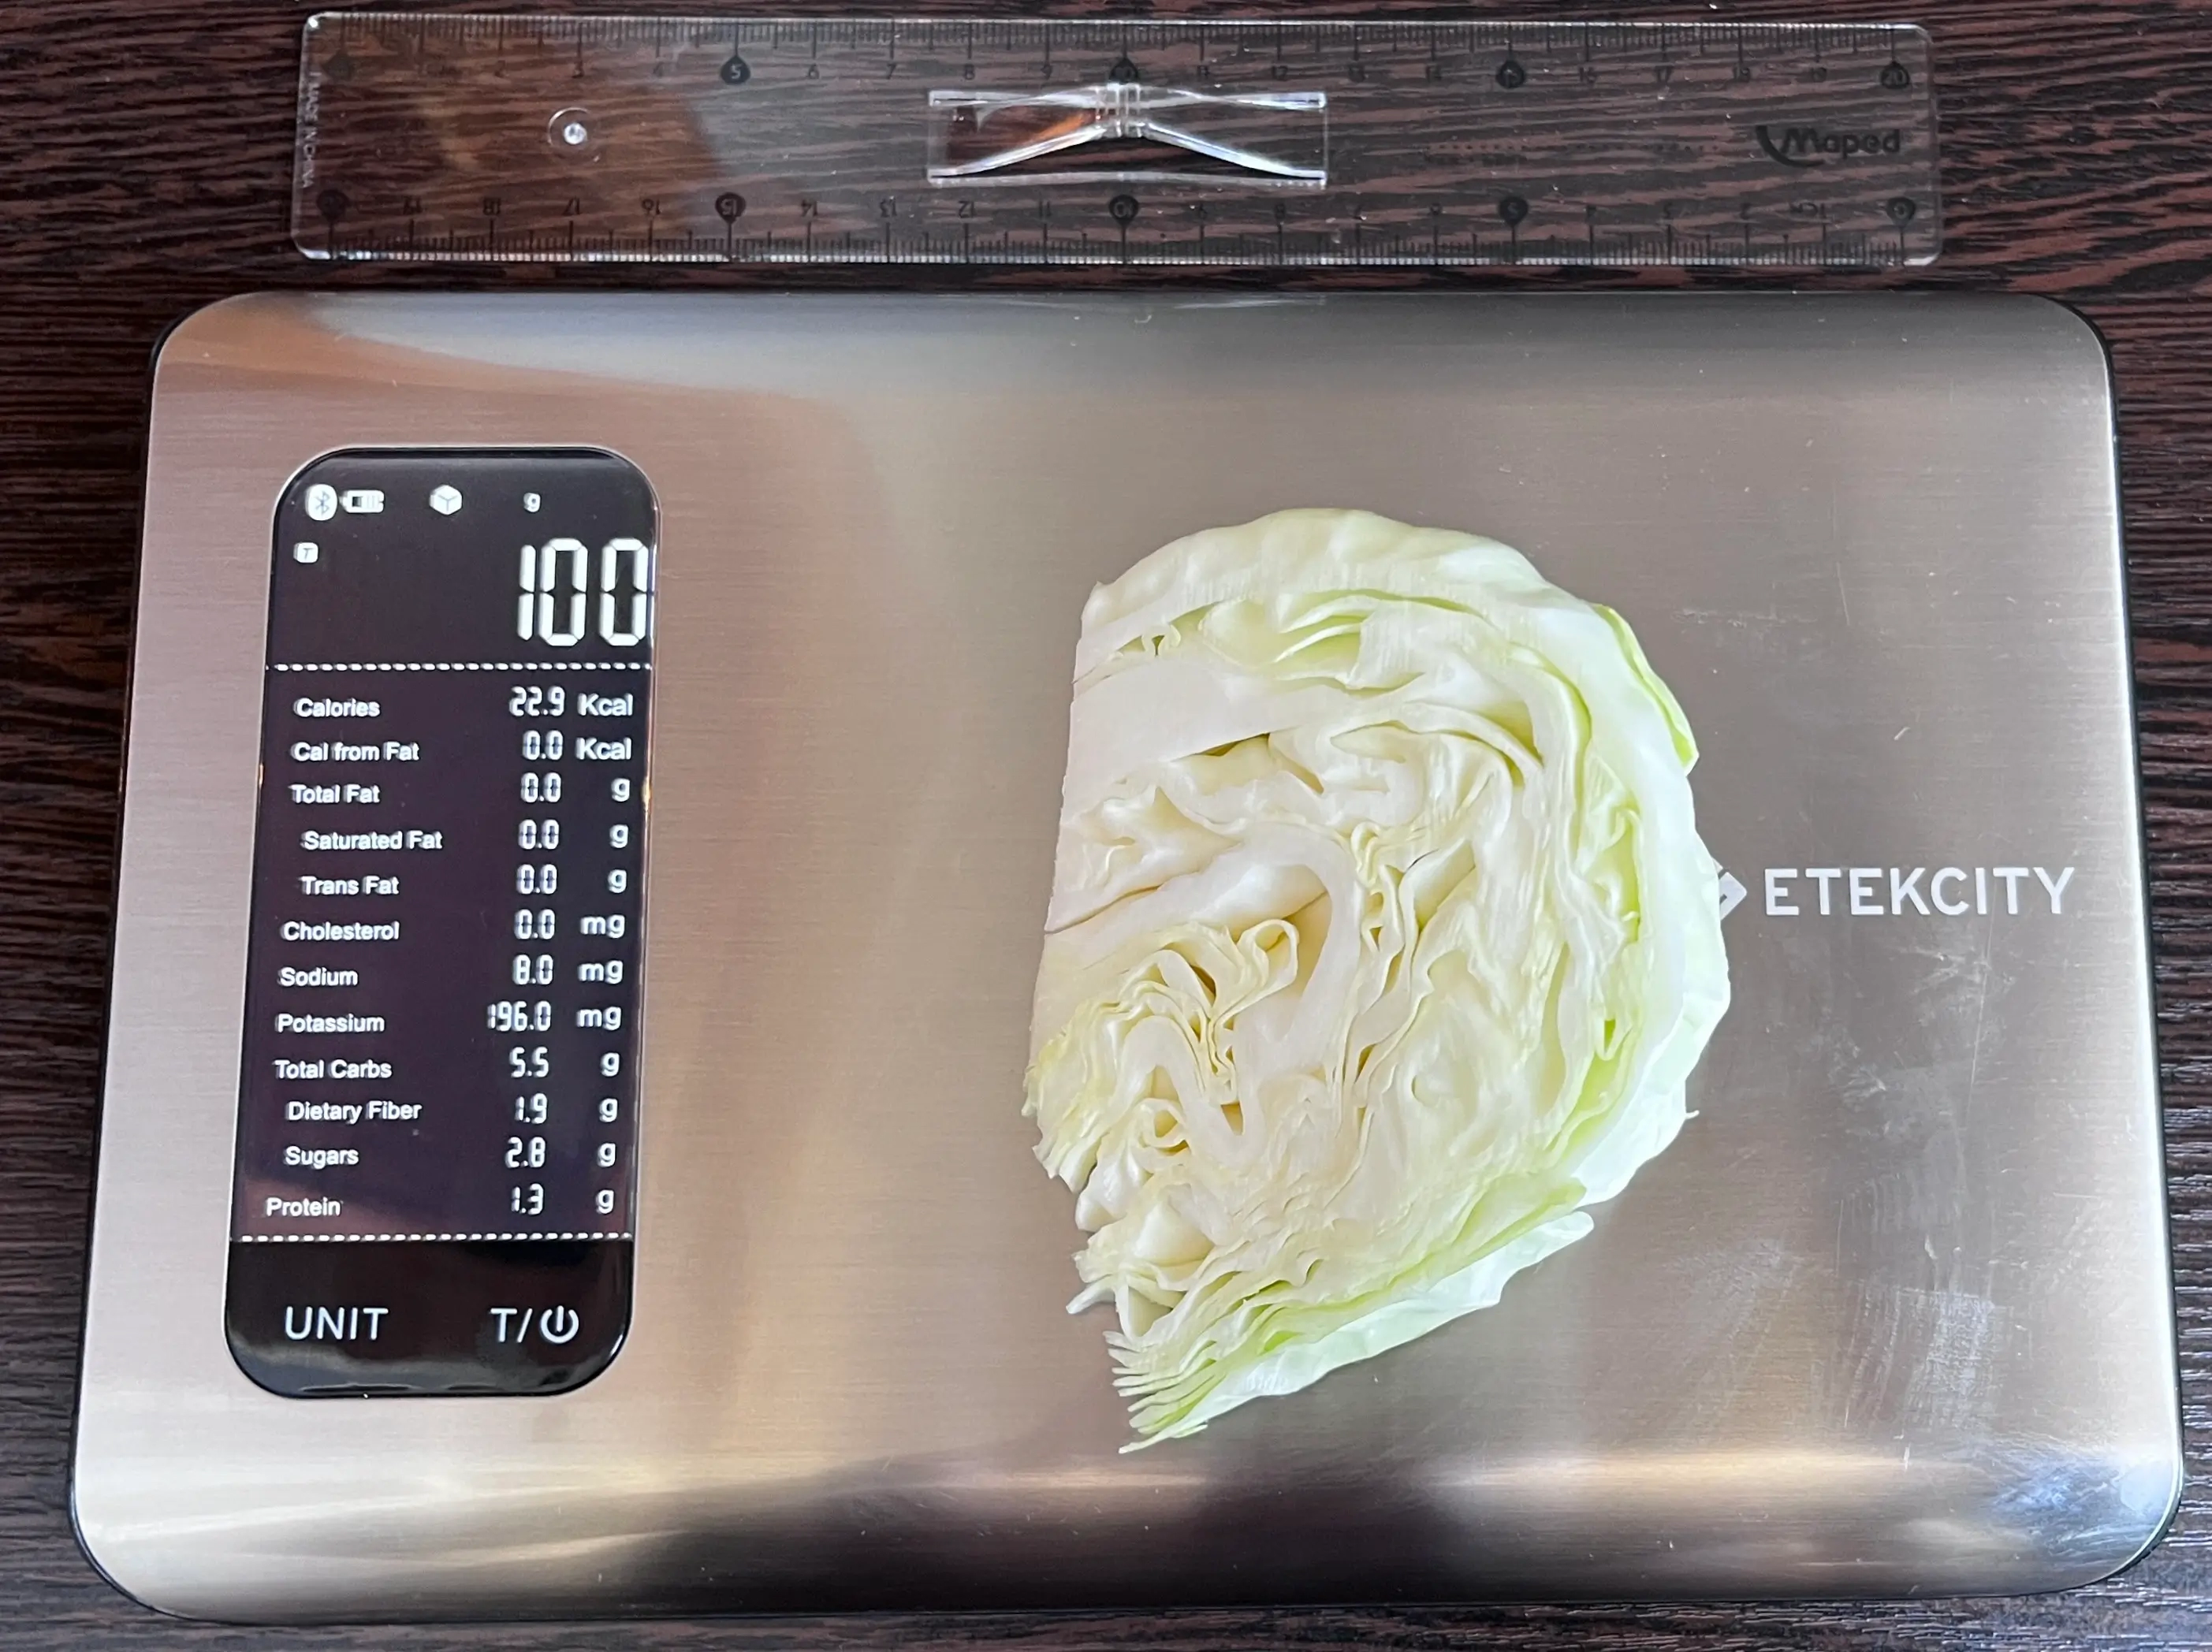
What Do 25 Calories or 100 Grams of Cabbage Look Like?
The picture above represents 100 grams of cabbage, which provides only about 25 calories. This makes cabbage a very light and filling food, thanks to its high water and fiber content. Its calories mainly come from carbohydrates, with very small amounts of protein and virtually no fat.
A typical cabbage head can weigh between 800 grams and 1.5 kilograms, meaning even a large portion adds relatively few calories to your diet. Depending on the variety and freshness, the calorie content may vary slightly.

Education: General Medicine at YSMU
Last updated: August 21, 2024
Medically reviewed by Elen Khachatrian
Top nutrition facts for Cabbage
| Calories ⓘ Calories for selected serving | 25 kcal |
|
Glycemic index ⓘ
Source: Check out our full article on Cabbage glycemic index Check out our Glycemic index chart page for the full list.
|
N/A (-) |
| Glycemic load ⓘ Glycemic Load (GL) is a metric that measures both the quality (Glycemic Index) and quantity of carbohydrates in a specific serving of food to estimate its impact on blood sugar levels. It is calculated as: (GI × Carbs in grams) / 100. | N/A |
| Net carbs ⓘ Net Carbs = Total Carbohydrates – Fiber – Sugar Alcohols | 3 g |
| Default serving size ⓘ Serving sizes are mostly taken from FDA's Reference Amounts Customarily Consumed (RACCs) | 1 cup, shredded (70 g) |
| Acidity (Based on PRAL) ⓘ PRAL (Potential renal acid load) is calculated using a formula. On the PRAL scale the higher the positive value, the more is the acidifying effect on the body. The lower the negative value, the higher the alkalinity of the food. 0 is neutral. | -2.8 (alkaline) |
| Oxalates | 4 mg ⓘ https://www.researchgate.net/publication/280642641 |
Cabbage calories (kcal)
| Calories for different serving sizes of cabbage | Calories | Weight |
|---|---|---|
| Calories in 100 grams | 25 | |
| Calories in 1 leaf | 4 | 15 g |
| Calories in 1 leaf, medium | 6 | 23 g |
| Calories in 1 leaf, large | 8 | 33 g |
| Calories in 1 cup, shredded | 18 | 70 g |
| Calories in 1 cup, chopped | 22 | 89 g |
Extra Nutrition facts for Cabbage
| Protein per 100 calories ⓘ Shows how many grams of protein you get from 100 calories of this food, calculated as (protein in g ÷ calories) × 100. | 5.1 g |
| Calories per 10 g protein ⓘ Shows how many calories you need to eat from this food to get 10 g of protein, calculated as (calories ÷ protein in g) × 10. | 195 kcal |
| Weight per 100 calories ⓘ Shows how many grams of this food equal 100 kcal—higher grams mean a larger portion for the same calories. | 400 g |
| Processing score ⓘ The processing score is a calculated value that looks at both how industrially made it is (NOVA) and how healthy/unprocessed the ingredients are (SIGA), then combines them into one score from 1 (least processed) to 4 (most processed). | 1 - Unprocessed ⓘ NOVA score = 1, SIGA score = A0 |
Cabbage Glycemic index (GI)
Source:
Check out our full article on Cabbage glycemic index
Check out our Glycemic index chart page for the full list.
Mineral coverage chart
Mineral chart - relative view
Vitamin coverage chart
Vitamin A:
15µg of 900µg
1.7%
Vitamin E:
0.45mg of 15mg
3%
Vitamin D:
0µg of 20µg
0%
Vitamin C:
110mg of 90mg
122%
Vitamin B1:
0.18mg of 1mg
15%
Vitamin B2:
0.12mg of 1mg
9.2%
Vitamin B3:
0.7mg of 16mg
4.4%
Vitamin B5:
0.64mg of 5mg
13%
Vitamin B6:
0.37mg of 1mg
29%
Folate:
129µg of 400µg
32%
Vitamin B12:
0µg of 2µg
0%
Vitamin K:
228µg of 120µg
190%
Vitamin chart - relative view
Macronutrients chart
Protein:
Daily Value: 3%
1.3 g of 50 g
1.3 g (3% of DV )
Fats:
Daily Value: 0%
0.1 g of 65 g
0.1 g (0% of DV )
Carbs:
Daily Value: 2%
5.8 g of 300 g
5.8 g (2% of DV )
Water:
Daily Value: 5%
92.2 g of 2,000 g
92.2 g (5% of DV )
Other:
0.6 g
0.6 g
Protein quality breakdown
Tryptophan:
33mg of 280mg
12%
Threonine:
105mg of 1,050mg
10%
Isoleucine:
90mg of 1,400mg
6.4%
Leucine:
123mg of 2,730mg
4.5%
Lysine:
132mg of 2,100mg
6.3%
Methionine:
36mg of 1,050mg
3.4%
Phenylalanine:
96mg of 1,750mg
5.5%
Valine:
126mg of 1,820mg
6.9%
Histidine:
66mg of 700mg
9.4%
Fat type information
Saturated fat:
0.03 g
Monounsaturated fat:
0.02 g
Polyunsaturated fat:
0.02 g
Carbohydrate type breakdown
Starch:
0 g
Sucrose:
0.08 g
Glucose:
1.7 g
Fructose:
1.5 g
Lactose:
0 g
Maltose:
0.01 g
Galactose:
0 g
Fiber content ratio for Cabbage
Sugar:
3.2 g
Fiber:
2.5 g
Other:
0.1 g
All nutrients for Cabbage per 100g
| Nutrient | Value | DV% | In TOP % of foods | Comparison |
| Vitamin A | 5µg | 1% | 40% | |
| Calories | 25kcal | 1% | 96% |
1.9 times less than Orange
|
| Protein per 100 calories | 5.1g | N/A | 45% | |
| Protein | 1.3g | 3% | 83% |
2.2 times less than Broccoli
|
| Calories per 10 g protein | 195kcal | N/A | 52% | |
| Weight per 100 calories | 400g | N/A | 5% | |
| Fats | 0.1g | 0% | 94% |
333.1 times less than Cheese
|
| Vitamin C | 37mg | 41% | 5% |
1.4 times less than Lemon
|
| Net carbs | 3.3g | N/A | 62% |
16.4 times less than Chocolate
|
| Carbs | 5.8g | 2% | 58% |
4.9 times less than Rice
|
| Cholesterol | 0mg | 0% | 100% |
N/A
|
| Vitamin D* | 0 IU | 0% | 100% |
N/A
|
| Vitamin D | 0µg | 0% | 100% |
N/A
|
| Magnesium | 12mg | 3% | 72% |
11.7 times less than Almonds
|
| Calcium | 40mg | 4% | 35% |
3.1 times less than Milk
|
| Potassium | 170mg | 5% | 62% |
1.2 times more than Cucumber
|
| Iron | 0.47mg | 6% | 77% |
5.5 times less than Beef broiled
|
| Sugar | 3.2g | N/A | 34% |
2.8 times less than Coca-Cola
|
| Fiber | 2.5g | 10% | 25% |
Equal to Orange
|
| Copper | 0.02mg | 2% | 79% |
7.5 times less than Shiitake
|
| Zinc | 0.18mg | 2% | 79% |
35.1 times less than Beef broiled
|
| Starch | 0g | 0% | 100% |
N/A
|
| Phosphorus | 26mg | 4% | 80% |
7 times less than Chicken meat
|
| Sodium | 18mg | 1% | 81% |
27.2 times less than White bread
|
| Vitamin E | 0.15mg | 1% | 48% |
9.7 times less than Kiwi
|
| Manganese | 0.16mg | 7% | 31% | |
| Selenium | 0.3µg | 1% | 73% | |
| Vitamin B1 | 0.06mg | 5% | 59% |
4.4 times less than Pea raw
|
| Vitamin B2 | 0.04mg | 3% | 78% |
3.3 times less than Avocado
|
| Vitamin B3 | 0.23mg | 1% | 79% |
40.9 times less than Turkey meat
|
| Vitamin B5 | 0.21mg | 4% | 55% |
5.3 times less than Sunflower seeds
|
| Vitamin B6 | 0.12mg | 10% | 49% |
Equal to Oats
|
| Vitamin B12 | 0µg | 0% | 100% |
N/A
|
| Vitamin K | 76µg | 63% | 3% |
1.3 times less than Broccoli
|
| Folate | 43µg | 11% | 23% |
1.4 times less than Brussels sprouts
|
| Trans fat | 0g | N/A | 100% |
N/A
|
| Saturated fat | 0.03g | 0% | 85% |
173.4 times less than Beef broiled
|
| Choline | 11mg | 2% | 40% | |
| Monounsaturated fat | 0.02g | N/A | 83% |
576.4 times less than Avocado
|
| Polyunsaturated fat | 0.02g | N/A | 87% |
2774.9 times less than Walnut
|
| Tryptophan | 0.01mg | 0% | 54% |
27.7 times less than Chicken meat
|
| Threonine | 0.04mg | 0% | 54% |
20.6 times less than Beef broiled
|
| Isoleucine | 0.03mg | 0% | 55% |
30.5 times less than Salmon raw
|
| Leucine | 0.04mg | 0% | 55% |
59.3 times less than Tuna Bluefin
|
| Lysine | 0.04mg | 0% | 54% |
10.3 times less than Tofu
|
| Methionine | 0.01mg | 0% | 54% |
8 times less than Quinoa
|
| Phenylalanine | 0.03mg | 0% | 55% |
20.9 times less than Egg
|
| Valine | 0.04mg | 0% | 54% |
48.3 times less than Soybean raw
|
| Histidine | 0.02mg | 0% | 54% |
34 times less than Turkey meat
|
| Fructose | 1.5g | 2% | 5% |
4.1 times less than Apple
|
| Caffeine | 0mg | 0% | 100% | |
| Omega-3 - EPA | 0g | N/A | 100% |
N/A
|
| Omega-3 - DHA | 0g | N/A | 100% |
N/A
|
| Omega-3 - DPA | 0g | N/A | 100% |
N/A
|
| Omega-6 - Eicosadienoic acid | 0g | N/A | 100% |
Check out similar food or compare with current

NUTRITION FACTS LABEL
Nutrition Facts
___servings per container
Serving Size ______________
Serving Size ______________
Amount Per 100g
Calories 25
% Daily Value*
0.15%
Total Fat
0.1g
0.15%
Saturated Fat 0.03g
0
Trans Fat
0g
0
Cholesterol 0mg
0.78%
Sodium 18mg
1.9%
Total Carbohydrate
5.8g
10%
Dietary Fiber
2.5g
Total Sugars 0g
Includes ? g Added Sugars
Protein
1.3g
Vitamin D
0mcg
0
Calcium
40mg
4%
Iron
0.47mg
5.9%
Potassium
170mg
5%
*
The % Daily Value (DV) tells you how much a nutrient in a serving of food contributes to a daily diet. 2,000 calories a day is used for general nutrition advice.
Health checks
ⓘ
Dietary cholesterol is not associated with an increased risk of coronary heart disease in healthy individuals. However, dietary cholesterol is common in foods that are high in harmful saturated fats.
Source
Low in Cholesterol
ⓘ
Trans fat consumption increases the risk of cardiovascular disease and mortality by negatively affecting blood lipid levels.
Source
No Trans Fats
ⓘ
Saturated fat intake can raise total cholesterol and LDL (low-density lipoprotein) levels, leading to an increased risk of atherosclerosis. Dietary guidelines recommend limiting saturated fats to under 10% of calories a day.
Source
Low in Saturated Fats
ⓘ
While the consumption of moderate amounts of added sugars is not detrimental to health, an excessive intake can increase the risk of obesity, and therefore, diabetes.
Source
Low in Sugars
Cabbage nutrition infographic
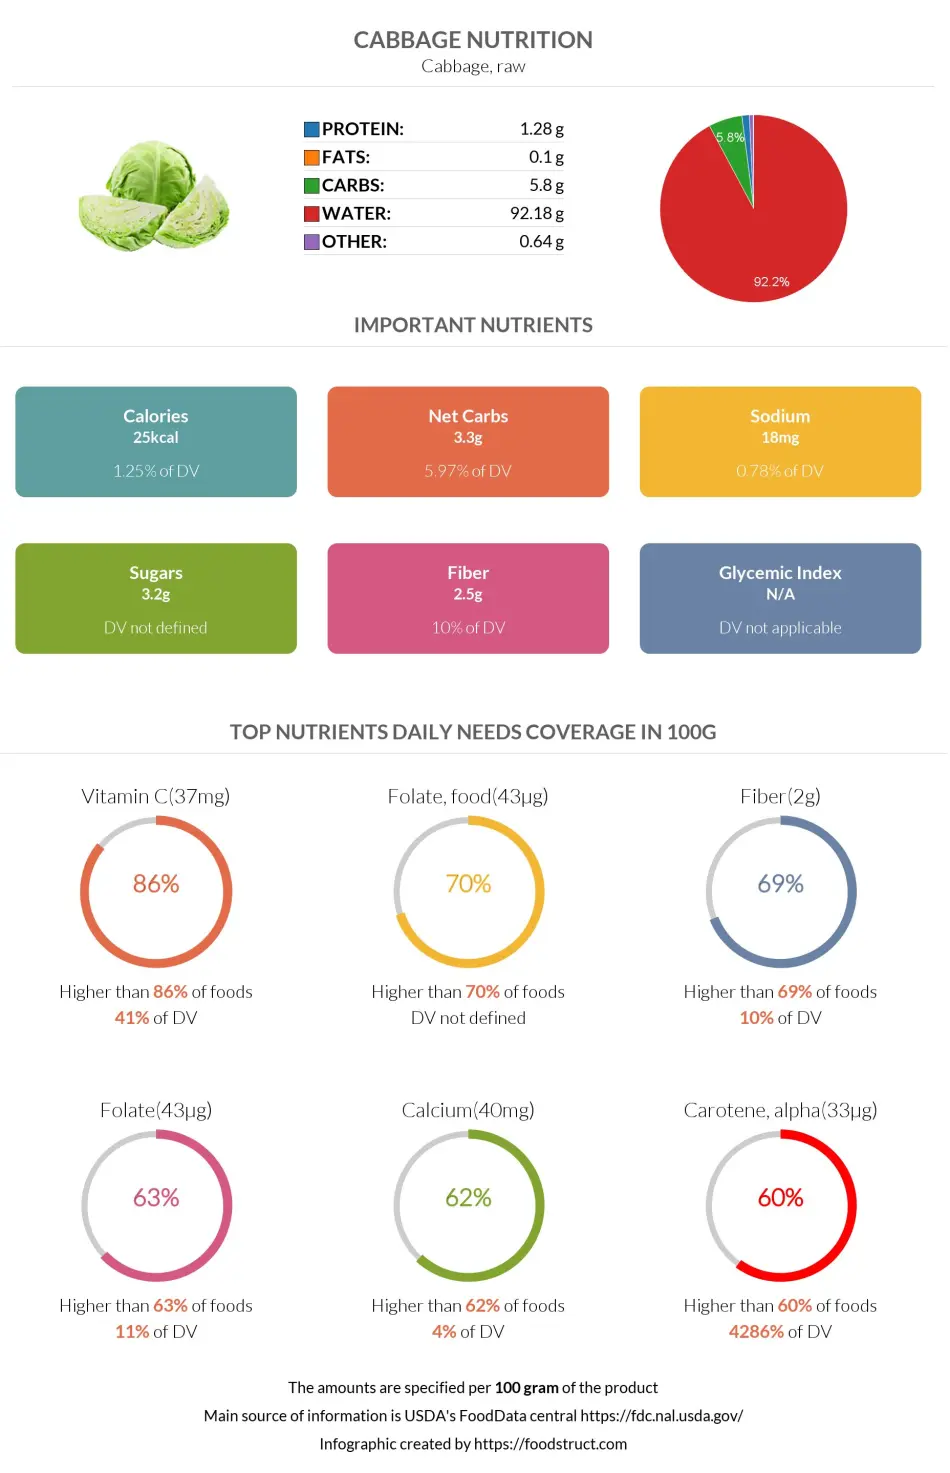
Infographic link
References
All the values for which the sources are not specified explicitly are taken from FDA’s Food Central. The exact link to the food presented on this page can be found below.