Parsley vs Spinach - In-Depth Nutrition Comparison


Summary
Spinach contains more manganese, folate, Vitamin E, Vitamin B6, Vitamin B2, and magnesium than parsley. It is also low in sugars and saturated fat.
Parsley is richer in Vitamin K, Vitamin C, Iron, and Vitamin B5 and has low sodium. B
Introduction
In this article, you can find a detailed description of the differences between spinach and parsley.
What's The Actual Difference?
Parsley and spinach are both used in cooking. Spinach is used as an independent dish in a baked form. Parsley is used as a flavoring or spice in a dry ground form. However, they differ in taste and appearance.
Parsley has a fresh, peppery flavor, a bright green color, and feathery leaves. It has solid, oblong leaves with a point at the end. Raw spinach has a mild, slightly sweet flavor that can be refreshing in salads, but the flavor becomes more acidic and robust when cooked. Spinach leaves are triangular or ovate and can be flat or puckered.
Nutrition
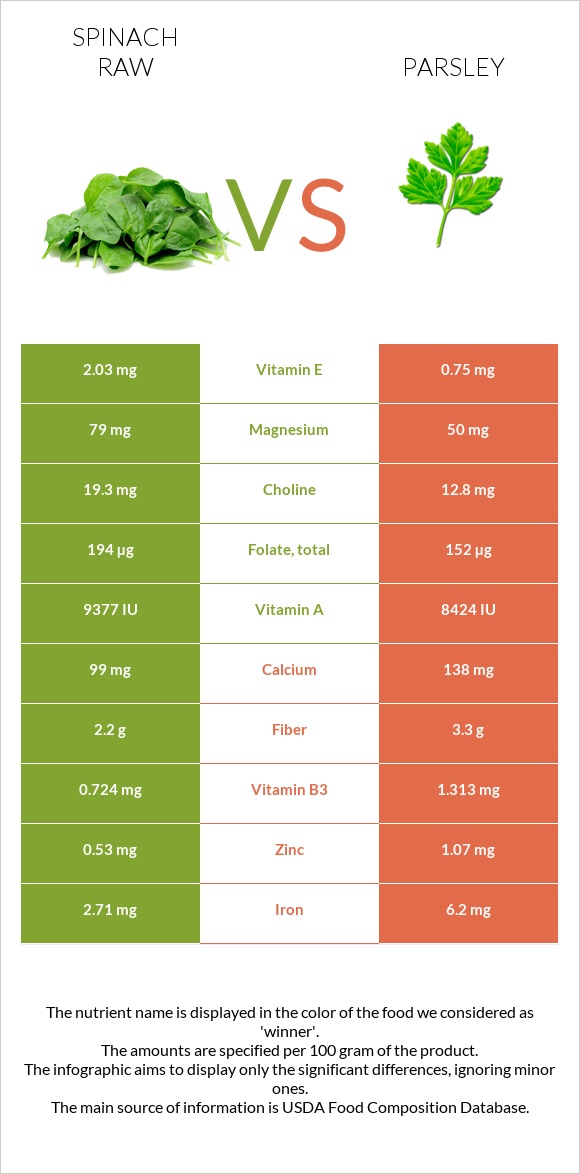
Below you can find the nutrition infographics that visually show the differences between parsnip and spinach.
Macronutrients
The main difference in macronutrient content is in carbs: parsley is two times higher in carbs than spinach. See the distribution of other nutrients in the infographic shown below.
Macronutrient Comparison
Contains
more
FatsFats
+102.6%
Contains
more
CarbsCarbs
+74.4%
Contains
more
OtherOther
+27.9%
Carbs
Parsley has two times more carbs than spinach: it contains 6.33g of carbs per 100g, whereas spinach contains 3.63g of carbs per 100g.
Parsley has 3.33g fiber and 3.02g net carbs. Spinach also has 2.2g of and 1.43g of net carbs.
They are both considered low-carb foods.
Fats
Both spinach and parsley have fats of less than 1g. Spinach contains 0.39g of fat, and parsley has 0.79g of fat.
Cholesterol
Spinach and parsley have no cholesterol.
Fat Type Comparison
Contains
less
Sat. FatSaturated fat
-52.3%
Contains
more
Poly. FatPolyunsaturated fat
+33.1%
Contains
more
Mono. FatMonounsaturated fat
+2850%
Protein
Spinach and parsley have tiny and equal amounts of protein: 3g.
Calories
Both spinach and parsley are low in calories. Spinach contains 23 calories per 100g, whereas parsley contains 36 calories per 100g.
Vitamins
Parsley contains three times more Vitamin C, two times more Vitamin K, and more Vitamin B3, Vitamin B5, and Vitamin B1.
Parsley falls in the range of the top 12% of foods as a source of Vitamin C.
On the other hand, spinach contains more Vitamin B6, Vitamin B2, Vitamin A, Vitamin E, and folate. Spinach falls in the range of the top 10% of foods as a source of Vitamin A.
Vitamin Comparison
Contains
more
Vitamin AVitamin A
+11.4%
Contains
more
Vitamin EVitamin E
+170.7%
Contains
more
Vitamin B2Vitamin B2
+92.9%
Contains
more
Vitamin B6Vitamin B6
+116.7%
Contains
more
FolateFolate
+27.6%
Contains
more
Vitamin CVitamin C
+373.3%
Contains
more
Vitamin B1Vitamin B1
+10.3%
Contains
more
Vitamin B3Vitamin B3
+81.4%
Contains
more
Vitamin B5Vitamin B5
+515.4%
Contains
more
Vitamin KVitamin K
+239.6%
Minerals
Parsley has a relatively higher amount of minerals than spinach. It contains more calcium, copper, zinc, phosphorus, iron, and less sodium than spinach.
Parsley falls in the range of the top 9% of foods as a source of iron. Spinach has more magnesium.
Mineral Comparison
Contains
more
MagnesiumMagnesium
+58%
Contains
more
ManganeseManganese
+460.6%
Contains
more
SeleniumSelenium
+900%
Contains
more
CalciumCalcium
+39.4%
Contains
more
IronIron
+128.8%
Contains
more
CopperCopper
+14.6%
Contains
more
ZincZinc
+101.9%
Contains
more
PhosphorusPhosphorus
+18.4%
Contains
less
SodiumSodium
-29.1%
Health Impact
Cardiovascular Health
Parsley's diuretic properties are most effective in hypertensive individuals and may aid in the removal of excess water from the body. Parsley is high in Vitamin K, which has anti-calcification properties in blood vessels, allowing for smooth blood flow and reducing the risk of plaque formation and atherosclerosis complications (1).
Spinach is high in nitrates, which have been shown to help moderate blood pressure and lower your risk of heart disease. In one study (2) of 27 people, eating spinach effectively reduced blood pressure. Several other studies have found similar results, indicating that spinach is beneficial to heart health.
Overall, both parsley and spinach can be valuable components of a heart-healthy diet, offering essential nutrients that support cardiovascular health when consumed as part of a balanced eating pattern.
Cancer
According to one study (3), parsley contains antioxidant flavonoids like apigenin, which has anti-carcinogenic properties in nearly all cancer cell lines.
Several human studies have found that eating spinach lowers the risk of prostate cancer. In one study (4), MGDG and SQDG (galactolipids) compounds in spinach were found to help slow tumor growth in the cervix. They also reduced the tumor's size. Consuming this leafy green may also aid in preventing breast cancer (5).
Diabetes
Parsley is high in Vitamin A. A new study (5) found that Vitamin A improves insulin-producing-cell function. The researchers first discovered that insulin-producing beta-cells have a high Vitamin A cell surface receptors concentration.
Moreover, parsnips are high in Vitamin C, a water-soluble vitamin that is a powerful antioxidant. According to some test-tube studies, it also contains polyacetylenes, which may have anti-cancer properties (6).
Eye Health
Spinach is high in zeaxanthin and lutein, which are carotenoids that give some vegetables their color. Human eyes contain a high concentration of these pigments, which protect your eyes from sun damage (7). Furthermore, several studies show that zeaxanthin and lutein help prevent macular degeneration and cataracts, significant causes of blindness (8).
Side Effects
Allergy
Spinach allergies are rare; however, reactions to spinach ingestion appear similar to those of oral allergy syndrome. Parsley can cause food allergy symptoms in people who are allergic to pollen, especially those with allergic rhinitis (9).
Kidney stones
Spinach is one of the foods with high oxalate content. Kidney stones are usually formed in the case of excess oxalate consumption (10). So, people with a high risk of nephrolithiasis should reduce spinach consumption (11).
References
- https://www.ncbi.nlm.nih.gov/pmc/articles/PMC4600246/
- https://pubmed.ncbi.nlm.nih.gov/22019438/
- https://pubmed.ncbi.nlm.nih.gov/32059077/
- https://www.sciencedirect.com/science/article/pii/B9780123746283000268
- https://pubmed.ncbi.nlm.nih.gov/17652276/
- https://www.ncbi.nlm.nih.gov/pmc/articles/PMC6542390/
- https://pubmed.ncbi.nlm.nih.gov/19168000/
- https://pubmed.ncbi.nlm.nih.gov/7933422/
- https://pubmed.ncbi.nlm.nih.gov/27795547/
- https://pubmed.ncbi.nlm.nih.gov/17538185/
- https://pubmed.ncbi.nlm.nih.gov/8335871/

Infographic
All nutrients comparison - raw data values
| Nutrient | |
|
DV% diff. |
| Vitamin K | 482.9µg | 1640µg | 964% |
| Vitamin C | 28.1mg | 133mg | 117% |
| Iron | 2.71mg | 6.2mg | 44% |
| Manganese | 0.897mg | 0.16mg | 32% |
| Folate | 194µg | 152µg | 11% |
| Vitamin E | 2.03mg | 0.75mg | 9% |
| Vitamin B6 | 0.195mg | 0.09mg | 8% |
| Magnesium | 79mg | 50mg | 7% |
| Vitamin B2 | 0.189mg | 0.098mg | 7% |
| Vitamin B5 | 0.065mg | 0.4mg | 7% |
| Zinc | 0.53mg | 1.07mg | 5% |
| Vitamin A | 469µg | 421µg | 5% |
| Calcium | 99mg | 138mg | 4% |
| Fiber | 2.2g | 3.3g | 4% |
| Vitamin B3 | 0.724mg | 1.313mg | 4% |
| Copper | 0.13mg | 0.149mg | 2% |
| Selenium | 1µg | 0.1µg | 2% |
| Calories | 23kcal | 36kcal | 1% |
| Fats | 0.39g | 0.79g | 1% |
| Carbs | 3.63g | 6.33g | 1% |
| Phosphorus | 49mg | 58mg | 1% |
| Sodium | 79mg | 56mg | 1% |
| Vitamin B1 | 0.078mg | 0.086mg | 1% |
| Choline | 19.3mg | 12.8mg | 1% |
| Monounsaturated fat | 0.01g | 0.295g | 1% |
| Protein | 2.86g | 2.97g | 0% |
| Protein per 100 calories | 12g | 8.3g | N/A |
| Calories per 10 g protein | 80kcal | 121kcal | N/A |
| Weight per 100 calories | 435g | 278g | N/A |
| Net carbs | 1.43g | 3.03g | N/A |
| Potassium | 558mg | 554mg | 0% |
| Sugar | 0.42g | 0.85g | N/A |
| Saturated fat | 0.063g | 0.132g | 0% |
| Polyunsaturated fat | 0.165g | 0.124g | 0% |
| Tryptophan | 0.039mg | 0.045mg | 0% |
| Threonine | 0.122mg | 0.122mg | 0% |
| Isoleucine | 0.147mg | 0.118mg | 0% |
| Leucine | 0.223mg | 0.204mg | 0% |
| Lysine | 0.174mg | 0.181mg | 0% |
| Methionine | 0.053mg | 0.042mg | 0% |
| Phenylalanine | 0.129mg | 0.145mg | 0% |
| Valine | 0.161mg | 0.172mg | 0% |
| Histidine | 0.064mg | 0.061mg | 0% |
| Fructose | 0.15g | 0% |
References
All the values for which the sources are not specified explicitly are taken from FDA’s Food Central. The exact link to the food presented on this page can be found below.
- Spinach raw - https://fdc.nal.usda.gov/fdc-app.html#/food-details/168462/nutrients
- Parsley - https://fdc.nal.usda.gov/fdc-app.html#/food-details/170416/nutrients
All the Daily Values are presented for males aged 31-50, for 2000-calorie diets.