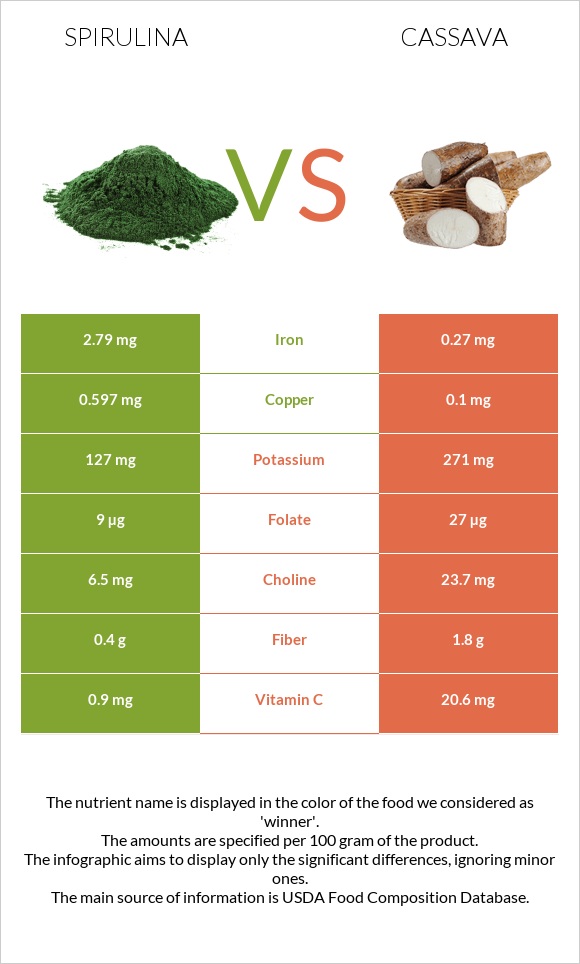
Significant differences between spirulina and cassava Spirulina has more copper, iron, vitamin B2, and vitamin B1; however, cassava is richer in vitamin C, manganese, and fiber. Spirulina covers your daily copper needs 55% more than cassava. Cassava has 10 times less iron than spirulina. Spirulina has 2.79mg of iron, while cassava has 0.27mg. Specific food types used in this comparison are Seaweed, spirulina, raw and Cassava, raw .
Infographic
Mineral Comparison
Mineral comparison score is based on the number of minerals by which one or the other food is richer. The "coverage" charts below show how much of the daily needs can be covered by 300 grams of the food.
2
100 g
300 g
Magnesium
Magnesium
Calcium
Calcium
Potassium
Potassium
Iron
Iron
Copper
Copper
Zinc
Zinc
Phosphorus
Phosphorus
Sodium
Sodium
Manganese
Manganese
Selenium
Selenium
14%
3.6%
11%
105%
199%
5.5%
4.7%
13%
24%
3.8%
7
100 g
300 g
1 cup - 206g 1 root - 408g
Magnesium
Magnesium
Calcium
Calcium
Potassium
Potassium
Iron
Iron
Copper
Copper
Zinc
Zinc
Phosphorus
Phosphorus
Sodium
Sodium
Manganese
Manganese
Selenium
Selenium
15%
4.8%
24%
10%
33%
9.3%
12%
1.8%
50%
3.8%
Vitamin Comparison
Vitamin comparison score is based on the number of vitamins by which one or the other food is richer. The "coverage" charts below show how much of the daily needs can be covered by 300 grams of the food.
7
100 g
300 g
Vitamin C
Vit. C
Vitamin D
Vit. D
Vitamin A
Vit. A
Vitamin E
Vit. E
Vitamin B1
Vit. B1
Vitamin B2
Vit. B2
Vitamin B3
Vit. B3
Vitamin B5
Vit. B5
Vitamin B6
Vit. B6
Vitamin B12
Vit. B12
Vitamin K
Vit. K
Folate
Folate
3%
0%
1%
9.8%
56%
79%
22%
20%
7.8%
0%
6.3%
6.8%
3
100 g
300 g
1 cup - 206g 1 root - 408g
Vitamin C
Vit. C
Vitamin D
Vit. D
Vitamin A
Vit. A
Vitamin E
Vit. E
Vitamin B1
Vit. B1
Vitamin B2
Vit. B2
Vitamin B3
Vit. B3
Vitamin B5
Vit. B5
Vitamin B6
Vit. B6
Vitamin B12
Vit. B12
Vitamin K
Vit. K
Folate
Folate
69%
0%
0.33%
3.8%
22%
11%
16%
6.4%
20%
0%
4.8%
20%
All nutrients comparison - raw data values
Nutrient
DV% diff.
Copper
0.597mg
0.1mg
55%
Iron
2.79mg
0.27mg
32%
Vitamin B2
0.342mg
0.048mg
23%
Vitamin C
0.9mg
20.6mg
22%
Carbs
2.42g
38.06g
12%
Vitamin B1
0.222mg
0.087mg
11%
Protein
5.92g
1.36g
9%
Manganese
0.186mg
0.384mg
9%
Calories
26kcal
160kcal
7%
Fiber
0.4g
1.8g
6%
Folate
9µg
27µg
5%
Potassium
127mg
271mg
4%
Sodium
98mg
14mg
4%
Vitamin B5
0.325mg
0.107mg
4%
Vitamin B6
0.034mg
0.088mg
4%
Choline
6.5mg
23.7mg
3%
Phosphorus
11mg
27mg
2%
Vitamin E
0.49mg
0.19mg
2%
Vitamin B3
1.196mg
0.854mg
2%
Zinc
0.2mg
0.34mg
1%
Vitamin K
2.5µg
1.9µg
1%
Protein per 100 calories
23g
0.85g
N/A
Calories per 10 g protein
44kcal
1176kcal
N/A
Weight per 100 calories
385g
63g
N/A
Fats
0.39g
0.28g
0%
Net carbs
2.02g
36.26g
N/A
Magnesium
19mg
21mg
0%
Calcium
12mg
16mg
0%
Sugar
0.3g
1.7g
N/A
Vitamin A
3µg
1µg
0%
Selenium
0.7µg
0.7µg
0%
Saturated fat
0.135g
0.074g
0%
Monounsaturated fat
0.034g
0.075g
0%
Polyunsaturated fat
0.106g
0.048g
0%
Tryptophan
0.096mg
0.019mg
0%
Threonine
0.306mg
0.028mg
0%
Isoleucine
0.331mg
0.027mg
0%
Leucine
0.509mg
0.039mg
0%
Lysine
0.312mg
0.044mg
0%
Methionine
0.118mg
0.011mg
0%
Phenylalanine
0.286mg
0.026mg
0%
Valine
0.362mg
0.035mg
0%
Histidine
0.112mg
0.02mg
0%
Macronutrient Comparison
Macronutrient breakdown side-by-side comparison
3
6%
2%
91%
Protein:
5.92 g
Fats:
0.39 g
Carbs:
2.42 g
Water:
90.67 g
Other:
0.6 g
2
38%
60%
Protein:
1.36 g
Fats:
0.28 g
Carbs:
38.06 g
Water:
59.68 g
Other:
0.62 g
Contains
more
Protein Protein
+335.3%
Contains
more
Fats Fats
+39.3%
Contains
more
Water Water
+51.9%
Contains
more
Carbs Carbs
+1472.7%
Fat Type Comparison
Fat type breakdown side-by-side comparison
1
49%
12%
39%
Saturated fat:
Sat. Fat
0.135 g
Monounsaturated fat:
Mono. Fat
0.034 g
Polyunsaturated fat:
Poly. Fat
0.106 g
2
38%
38%
24%
Saturated fat:
Sat. Fat
0.074 g
Monounsaturated fat:
Mono. Fat
0.075 g
Polyunsaturated fat:
Poly. Fat
0.048 g
Contains
more
Poly. Fat Polyunsaturated fat
+120.8%
Contains
less
Sat. Fat Saturated fat
-45.2%
Contains
more
Mono. Fat Monounsaturated fat
+120.6%