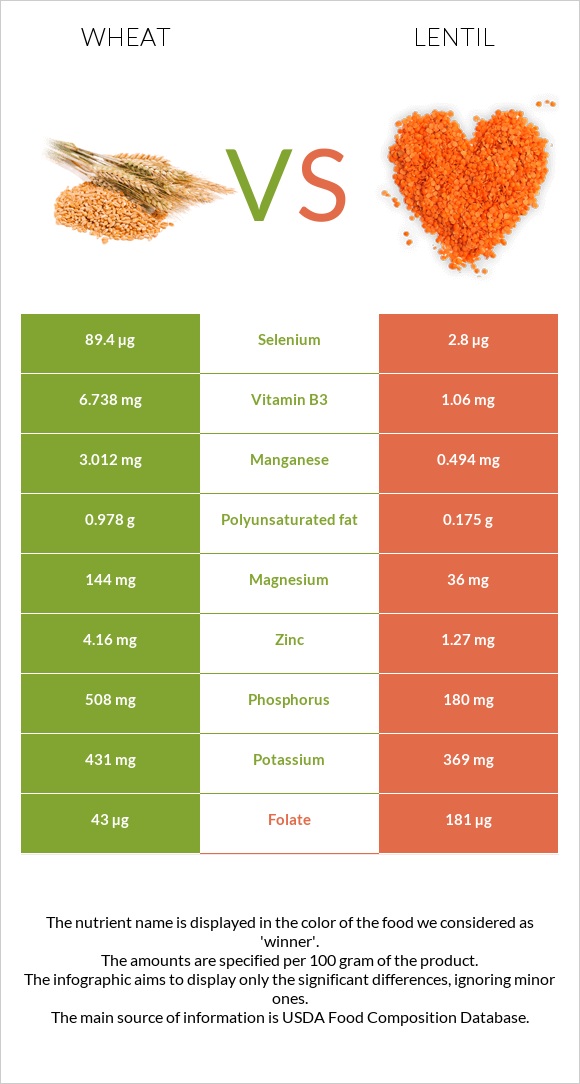
What are the main differences between wheat and lentil? Wheat is richer in selenium, manganese, phosphorus, vitamin B3, copper, zinc, magnesium, vitamin B1, and vitamin B6, yet lentil is richer in folate. Wheat 's daily need coverage for selenium is 157% higher. Wheat has 6 times more vitamin B3 than lentil. Wheat has 6.738mg of vitamin B3, while lentil has 1.06mg. Lentil has a lower glycemic index than wheat . We used Wheat, durum and Lentils, mature seeds, cooked, boiled, without salt types in this comparison.
Infographic
Mineral Comparison
Mineral comparison score is based on the number of minerals by which one or the other food is richer. The "coverage" charts below show how much of the daily needs can be covered by 300 grams of the food.
8
100 g
300 g
1 cup - 192g
Magnesium
Magnesium
Calcium
Calcium
Potassium
Potassium
Iron
Iron
Copper
Copper
Zinc
Zinc
Phosphorus
Phosphorus
Sodium
Sodium
Manganese
Manganese
Selenium
Selenium
103%
10%
38%
132%
184%
113%
218%
0.26%
393%
488%
0
100 g
300 g
1 tbsp - 12.3g 1 cup - 198g
Magnesium
Magnesium
Calcium
Calcium
Potassium
Potassium
Iron
Iron
Copper
Copper
Zinc
Zinc
Phosphorus
Phosphorus
Sodium
Sodium
Manganese
Manganese
Selenium
Selenium
26%
5.7%
33%
125%
84%
35%
77%
0.26%
64%
15%
Vitamin Comparison
Vitamin comparison score is based on the number of vitamins by which one or the other food is richer. The "coverage" charts below show how much of the daily needs can be covered by 300 grams of the food.
5
100 g
300 g
1 cup - 192g
Vitamin C
Vit. C
Vitamin D
Vit. D
Vitamin A
Vit. A
Vitamin E
Vit. E
Vitamin B1
Vit. B1
Vitamin B2
Vit. B2
Vitamin B3
Vit. B3
Vitamin B5
Vit. B5
Vitamin B6
Vit. B6
Vitamin B12
Vit. B12
Vitamin K
Vit. K
Folate
Folate
0%
0%
0%
0%
105%
28%
126%
56%
97%
0%
0%
32%
4
100 g
300 g
1 tbsp - 12.3g 1 cup - 198g
Vitamin C
Vit. C
Vitamin D
Vit. D
Vitamin A
Vit. A
Vitamin E
Vit. E
Vitamin B1
Vit. B1
Vitamin B2
Vit. B2
Vitamin B3
Vit. B3
Vitamin B5
Vit. B5
Vitamin B6
Vit. B6
Vitamin B12
Vit. B12
Vitamin K
Vit. K
Folate
Folate
5%
0%
0%
2.2%
42%
17%
20%
38%
41%
0%
4.3%
136%
All nutrients comparison - raw data values
Nutrient
DV% diff.
Selenium
89.4µg
2.8µg
157%
Manganese
3.012mg
0.494mg
109%
Phosphorus
508mg
180mg
47%
Vitamin B3
6.738mg
1.06mg
35%
Folate
43µg
181µg
35%
Copper
0.553mg
0.251mg
34%
Fiber
7.9g
32%
Magnesium
144mg
36mg
26%
Zinc
4.16mg
1.27mg
26%
Vitamin B1
0.419mg
0.169mg
21%
Vitamin B6
0.419mg
0.178mg
19%
Carbs
71.13g
20.13g
17%
Calories
339kcal
116kcal
11%
Protein
13.68g
9.02g
9%
Vitamin B5
0.935mg
0.638mg
6%
Choline
32.7mg
6%
Polyunsaturated fat
0.978g
0.175g
5%
Vitamin B2
0.121mg
0.073mg
4%
Fats
2.47g
0.38g
3%
Vitamin C
0mg
1.5mg
2%
Calcium
34mg
19mg
2%
Potassium
431mg
369mg
2%
Iron
3.52mg
3.33mg
2%
Saturated fat
0.454g
0.053g
2%
Vitamin E
0.11mg
1%
Vitamin K
1.7µg
1%
Monounsaturated fat
0.344g
0.064g
1%
Protein per 100 calories
4g
7.8g
N/A
Calories per 10 g protein
248kcal
129kcal
N/A
Weight per 100 calories
29g
86g
N/A
Unsaturated / Saturated Fat ratio
2.9
4.5
N/A
Net carbs
71.13g
12.23g
N/A
Sugar
1.8g
N/A
Sodium
2mg
2mg
0%
Tryptophan
0.176mg
0.081mg
0%
Threonine
0.366mg
0.323mg
0%
Isoleucine
0.533mg
0.39mg
0%
Leucine
0.934mg
0.654mg
0%
Lysine
0.303mg
0.63mg
0%
Methionine
0.221mg
0.077mg
0%
Phenylalanine
0.681mg
0.445mg
0%
Valine
0.594mg
0.448mg
0%
Histidine
0.322mg
0.254mg
0%
Macronutrient Comparison
Macronutrient breakdown side-by-side comparison
4
14%
2%
71%
11%
2%
Protein:
13.68 g
Fats:
2.47 g
Carbs:
71.13 g
Water:
10.94 g
Other:
1.78 g
1
9%
20%
70%
Protein:
9.02 g
Fats:
0.38 g
Carbs:
20.13 g
Water:
69.64 g
Other:
0.83 g
Contains
more
Protein Protein
+51.7%
Contains
more
Fats Fats
+550%
Contains
more
Carbs Carbs
+253.4%
Contains
more
Other Other
+114.5%
Contains
more
Water Water
+536.6%
Fat Type Comparison
Fat type breakdown side-by-side comparison
2
26%
19%
55%
Saturated fat:
Sat. Fat
0.454 g
Monounsaturated fat:
Mono. Fat
0.344 g
Polyunsaturated fat:
Poly. Fat
0.978 g
1
18%
22%
60%
Saturated fat:
Sat. Fat
0.053 g
Monounsaturated fat:
Mono. Fat
0.064 g
Polyunsaturated fat:
Poly. Fat
0.175 g
Contains
more
Mono. Fat Monounsaturated fat
+437.5%
Contains
more
Poly. Fat Polyunsaturated fat
+458.9%
Contains
less
Sat. Fat Saturated fat
-88.3%