Differences between almonds and spelt Almonds are higher in vitamin E, vitamin B2, copper, magnesium, and calcium; however, spelt is richer in manganese, vitamin B3, selenium, and vitamin B1. Almonds' daily need coverage for vitamin E is 166% higher. Almonds have 10 times more vitamin B2 than spelt. While almonds have 1.138mg of vitamin B2, spelt has only 0.113mg. Spelt has less saturated fat. Almonds have a lower glycemic index (0) than spelt (63). The food types used in this comparison are Nuts, almonds and Spelt, uncooked .
Infographic
Mineral Comparison
Mineral comparison score is based on the number of minerals by which one or the other food is richer. The "coverage" charts below show how much of the daily needs can be covered by 300 grams of the food.
6
100 g
300 g
1 almond - 1.2g 1 oz (23 whole kernels) - 28.35g 1 cup, sliced - 92g 1 cup, ground - 95g 1 cup, slivered - 108g 1 cup, whole - 143g
Magnesium
Magnesium
Calcium
Calcium
Potassium
Potassium
Iron
Iron
Copper
Copper
Zinc
Zinc
Phosphorus
Phosphorus
Sodium
Sodium
Manganese
Manganese
Selenium
Selenium
193%
81%
65%
139%
344%
85%
206%
0.13%
284%
22%
3
100 g
300 g
1 cup - 174g
Magnesium
Magnesium
Calcium
Calcium
Potassium
Potassium
Iron
Iron
Copper
Copper
Zinc
Zinc
Phosphorus
Phosphorus
Sodium
Sodium
Manganese
Manganese
Selenium
Selenium
97%
8.1%
34%
167%
170%
89%
172%
1%
389%
64%
Vitamin Comparison
Vitamin comparison score is based on the number of vitamins by which one or the other food is richer. The "coverage" charts below show how much of the daily needs can be covered by 300 grams of the food.
2
100 g
300 g
1 almond - 1.2g 1 oz (23 whole kernels) - 28.35g 1 cup, sliced - 92g 1 cup, ground - 95g 1 cup, slivered - 108g 1 cup, whole - 143g
Vitamin C
Vit. C
Vitamin D
Vit. D
Vitamin A
Vit. A
Vitamin E
Vit. E
Vitamin B1
Vit. B1
Vitamin B2
Vit. B2
Vitamin B3
Vit. B3
Vitamin B5
Vit. B5
Vitamin B6
Vit. B6
Vitamin B12
Vit. B12
Vitamin K
Vit. K
Folate
Folate
0%
0%
0%
513%
51%
263%
68%
28%
32%
0%
0%
33%
5
100 g
300 g
1 cup - 174g
Vitamin C
Vit. C
Vitamin D
Vit. D
Vitamin A
Vit. A
Vitamin E
Vit. E
Vitamin B1
Vit. B1
Vitamin B2
Vit. B2
Vitamin B3
Vit. B3
Vitamin B5
Vit. B5
Vitamin B6
Vit. B6
Vitamin B12
Vit. B12
Vitamin K
Vit. K
Folate
Folate
0%
0%
0%
16%
91%
26%
128%
64%
53%
0%
9%
34%
All nutrients comparison - raw data values
Nutrient
DV% diff.
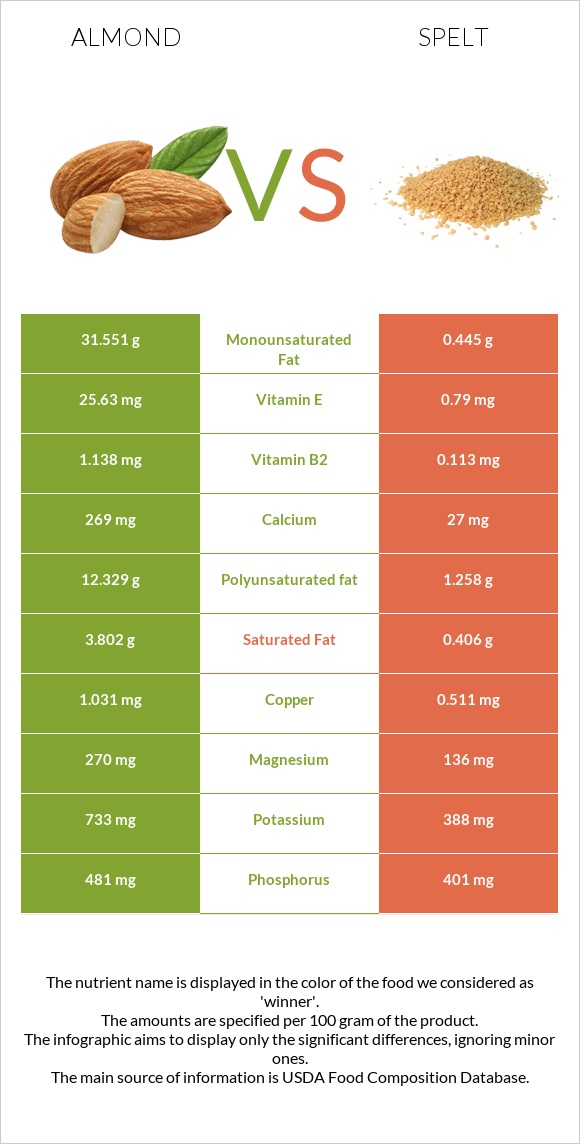
Vitamin E
25.63mg
0.79mg
166%
Vitamin B2
1.138mg
0.113mg
79%
Monounsaturated fat
31.551g
0.445g
78%
Polyunsaturated fat
12.329g
1.258g
74%
Fats
49.93g
2.43g
73%
Copper
1.031mg
0.511mg
58%
Manganese
2.179mg
2.983mg
35%
Magnesium
270mg
136mg
32%
Calcium
269mg
27mg
24%
Starch
0.72g
53.92g
22%
Vitamin B3
3.618mg
6.843mg
20%
Carbs
21.55g
70.19g
16%
Saturated fat
3.802g
0.406g
15%
Selenium
4.1µg
11.7µg
14%
Protein
21.15g
14.57g
13%
Vitamin B1
0.205mg
0.364mg
13%
Calories
579kcal
338kcal
12%
Vitamin B5
0.471mg
1.068mg
12%
Phosphorus
481mg
401mg
11%
Potassium
733mg
388mg
10%
Iron
3.71mg
4.44mg
9%
Choline
52.1mg
9%
Fiber
12.5g
10.7g
7%
Vitamin B6
0.137mg
0.23mg
7%
Vitamin K
0µg
3.6µg
3%
Zinc
3.12mg
3.28mg
1%
Protein per 100 calories
3.7g
4.3g
N/A
Calories per 10 g protein
274kcal
232kcal
N/A
Weight per 100 calories
17g
30g
N/A
Unsaturated / Saturated Fat ratio
12
4.2
N/A
Net carbs
9.05g
59.49g
N/A
Sugar
4.35g
6.82g
N/A
Sodium
1mg
8mg
0%
Folate
44µg
45µg
0%
Trans fat
0.015g
N/A
Tryptophan
0.211mg
0.132mg
0%
Threonine
0.601mg
0.443mg
0%
Isoleucine
0.751mg
0.552mg
0%
Leucine
1.473mg
1.07mg
0%
Lysine
0.568mg
0.409mg
0%
Methionine
0.157mg
0.258mg
0%
Phenylalanine
1.132mg
0.737mg
0%
Valine
0.855mg
0.681mg
0%
Histidine
0.539mg
0.36mg
0%
Fructose
0.11g
0.24g
0%
Omega-3 - ALA
0.003g
0.065g
N/A
Omega-6 - Eicosadienoic acid
0.002g
0g
N/A
Omega-6 - Linoleic acid
12.32g
N/A
Macronutrient Comparison
Macronutrient breakdown side-by-side comparison
3
21%
50%
22%
4%
3%
Protein:
21.15 g
Fats:
49.93 g
Carbs:
21.55 g
Water:
4.41 g
Other:
2.96 g
2
15%
2%
70%
11%
2%
Protein:
14.57 g
Fats:
2.43 g
Carbs:
70.19 g
Water:
11.02 g
Other:
1.79 g
Contains
more
Protein Protein
+45.2%
Contains
more
Fats Fats
+1954.7%
Contains
more
Other Other
+65.4%
Contains
more
Carbs Carbs
+225.7%
Contains
more
Water Water
+149.9%
Fat Type Comparison
Fat type breakdown side-by-side comparison
2
8%
66%
26%
Saturated fat:
Sat. Fat
3.802 g
Monounsaturated fat:
Mono. Fat
31.551 g
Polyunsaturated fat:
Poly. Fat
12.329 g
1
19%
21%
60%
Saturated fat:
Sat. Fat
0.406 g
Monounsaturated fat:
Mono. Fat
0.445 g
Polyunsaturated fat:
Poly. Fat
1.258 g
Contains
more
Mono. Fat Monounsaturated fat
+6990.1%
Contains
more
Poly. Fat Polyunsaturated fat
+880%
Contains
less
Sat. Fat Saturated fat
-89.3%
Carbohydrate type comparison
Carbohydrate type breakdown side-by-side comparison
2
14%
78%
3%
2%
Starch:
0.72 g
Sucrose:
3.95 g
Glucose:
0.17 g
Fructose:
0.11 g
Lactose:
0 g
Maltose:
0.04 g
Galactose:
0.07 g
4
89%
8%
Starch:
53.92 g
Sucrose:
0.59 g
Glucose:
0.84 g
Fructose:
0.24 g
Lactose:
0 g
Maltose:
5.15 g
Galactose:
0 g
Contains
more
Sucrose Sucrose
+569.5%
Contains
more
Galactose Galactose
+∞%
Contains
more
Starch Starch
+7388.9%
Contains
more
Glucose Glucose
+394.1%
Contains
more
Fructose Fructose
+118.2%
Contains
more
Maltose Maltose
+12775%