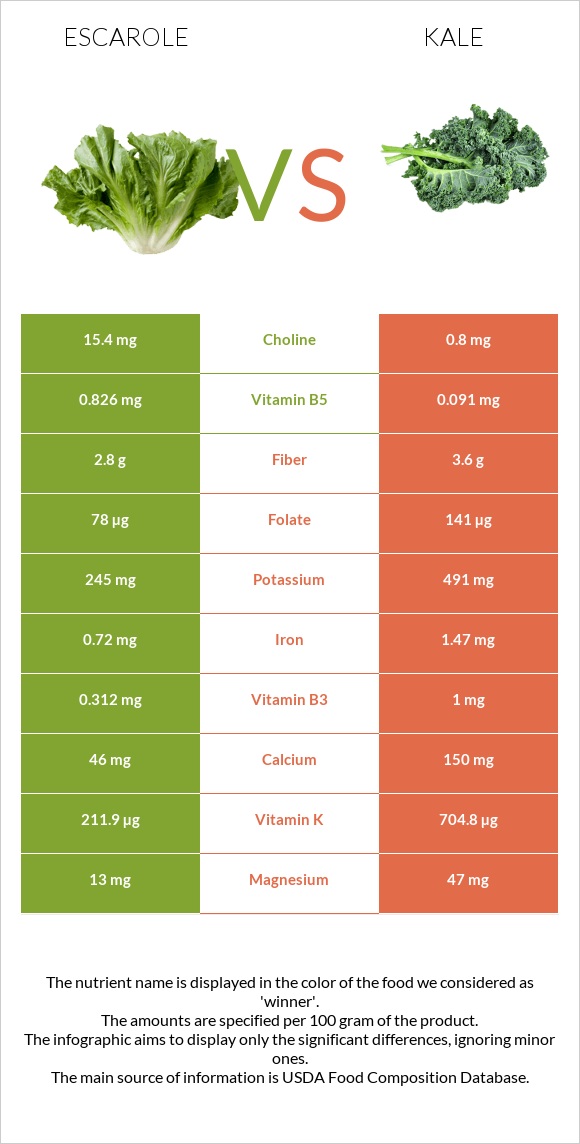
How are escarole and kale different? Escarole is richer in folate and vitamin B5, while kale is higher in vitamin K, vitamin A, vitamin C, vitamin B6, and copper. Kale covers your daily need for vitamin K, 504% more than escarole. Escarole contains 39 times more choline than kale. Escarole contains 15.4mg of choline, while kale contains 0.4mg. Escarole, cooked, boiled, drained, no salt added and Kale, cooked, boiled, drained, without salt types were used in this article.
Infographic
Mineral Comparison
Mineral comparison score is based on the number of minerals by which one or the other food is richer. The "coverage" charts below show how much of the daily needs can be covered by 300 grams of the food.
2
100 g
300 g
1 cup - 150g
Magnesium
Magnesium
Calcium
Calcium
Potassium
Potassium
Iron
Iron
Copper
Copper
Zinc
Zinc
Phosphorus
Phosphorus
Sodium
Sodium
Manganese
Manganese
Selenium
Selenium
9.3%
14%
22%
27%
29%
19%
9.4%
2.5%
50%
1.1%
6
100 g
300 g
1 cup, chopped - 130g
Magnesium
Magnesium
Calcium
Calcium
Potassium
Potassium
Iron
Iron
Copper
Copper
Zinc
Zinc
Phosphorus
Phosphorus
Sodium
Sodium
Manganese
Manganese
Selenium
Selenium
13%
22%
20%
34%
52%
6.5%
12%
3%
54%
4.9%
Vitamin Comparison
Vitamin comparison score is based on the number of vitamins by which one or the other food is richer. The "coverage" charts below show how much of the daily needs can be covered by 300 grams of the food.
3
100 g
300 g
1 cup - 150g
Vitamin C
Vit. C
Vitamin D
Vit. D
Vitamin A
Vit. A
Vitamin E
Vit. E
Vitamin B1
Vit. B1
Vitamin B2
Vit. B2
Vitamin B3
Vit. B3
Vitamin B5
Vit. B5
Vitamin B6
Vit. B6
Vitamin B12
Vit. B12
Vitamin K
Vit. K
Folate
Folate
11%
0%
31%
8%
15%
14%
5.9%
50%
3.7%
0%
530%
59%
7
100 g
300 g
1 cup, chopped - 130g
Vitamin C
Vit. C
Vitamin D
Vit. D
Vitamin A
Vit. A
Vitamin E
Vit. E
Vitamin B1
Vit. B1
Vitamin B2
Vit. B2
Vitamin B3
Vit. B3
Vitamin B5
Vit. B5
Vitamin B6
Vit. B6
Vitamin B12
Vit. B12
Vitamin K
Vit. K
Folate
Folate
137%
0%
227%
17%
13%
16%
9.4%
2.9%
32%
0%
2043%
9.8%
All nutrients comparison - raw data values
Nutrient
DV% diff.
Vitamin K
211.9µg
817µg
504%
Vitamin A
94µg
681µg
65%
Vitamin C
3.3mg
41mg
42%
Vitamin B5
0.826mg
0.049mg
16%
Folate
78µg
13µg
16%
Vitamin B6
0.016mg
0.138mg
9%
Copper
0.087mg
0.156mg
8%
Zinc
0.69mg
0.24mg
4%
Calcium
46mg
72mg
3%
Fiber
2.8g
2g
3%
Vitamin E
0.4mg
0.85mg
3%
Choline
15.4mg
0.4mg
3%
Protein
1.15g
1.9g
2%
Iron
0.72mg
0.9mg
2%
Carbs
3.07g
5.63g
1%
Magnesium
13mg
18mg
1%
Potassium
245mg
228mg
1%
Phosphorus
22mg
28mg
1%
Manganese
0.385mg
0.416mg
1%
Selenium
0.2µg
0.9µg
1%
Vitamin B1
0.059mg
0.053mg
1%
Vitamin B2
0.062mg
0.07mg
1%
Vitamin B3
0.312mg
0.5mg
1%
Polyunsaturated fat
0.081g
0.193g
1%
Calories
19kcal
28kcal
0%
Protein per 100 calories
6.1g
6.8g
N/A
Calories per 10 g protein
165kcal
147kcal
N/A
Weight per 100 calories
526g
357g
N/A
Fats
0.18g
0.4g
0%
Net carbs
0.27g
3.63g
N/A
Sugar
0.23g
1.25g
N/A
Sodium
19mg
23mg
0%
Saturated fat
0.042g
0.052g
0%
Monounsaturated fat
0.004g
0.03g
0%
Tryptophan
0.005mg
0.023mg
0%
Threonine
0.046mg
0.085mg
0%
Isoleucine
0.066mg
0.114mg
0%
Leucine
0.09mg
0.133mg
0%
Lysine
0.058mg
0.114mg
0%
Methionine
0.013mg
0.018mg
0%
Phenylalanine
0.049mg
0.097mg
0%
Valine
0.058mg
0.104mg
0%
Histidine
0.021mg
0.04mg
0%
Macronutrient Comparison
Macronutrient breakdown side-by-side comparison
2
3%
94%
Protein:
1.15 g
Fats:
0.18 g
Carbs:
3.07 g
Water:
94.29 g
Other:
1.31 g
3
2%
6%
91%
Protein:
1.9 g
Fats:
0.4 g
Carbs:
5.63 g
Water:
91.2 g
Other:
0.87 g
Contains
more
Other Other
+50.6%
Contains
more
Protein Protein
+65.2%
Contains
more
Fats Fats
+122.2%
Contains
more
Carbs Carbs
+83.4%
Fat Type Comparison
Fat type breakdown side-by-side comparison
1
33%
3%
64%
Saturated fat:
Sat. Fat
0.042 g
Monounsaturated fat:
Mono. Fat
0.004 g
Polyunsaturated fat:
Poly. Fat
0.081 g
2
19%
11%
70%
Saturated fat:
Sat. Fat
0.052 g
Monounsaturated fat:
Mono. Fat
0.03 g
Polyunsaturated fat:
Poly. Fat
0.193 g
Contains
less
Sat. Fat Saturated fat
-19.2%
Contains
more
Mono. Fat Monounsaturated fat
+650%
Contains
more
Poly. Fat Polyunsaturated fat
+138.3%