
Pork, fresh, loin, tenderloin, separable lean only, cooked, broiled vs. Ham — In-Depth Nutrition Comparison
Compare
What are the differences between pork, fresh, loin, tenderloin, separable lean only, cooked, broiled and ham?
- Pork, fresh, loin, tenderloin, separable lean only, cooked, broiled is richer than ham in selenium, protein, vitamin B1, vitamin B12, vitamin B2, phosphorus, vitamin B5, and vitamin B6.
- Pork, fresh, loin, tenderloin, separable lean only, cooked, broiled's daily need coverage for selenium is 58% more.
- Pork, fresh, loin, tenderloin, separable lean only, cooked, broiled has 2 times more vitamin B5 than ham. While pork, fresh, loin, tenderloin, separable lean only, cooked, broiled has 0.917mg of vitamin B5, ham has only 0.403mg.
- The amount of cholesterol in ham is lower.
We used Pork, fresh, loin, tenderloin, separable lean only, cooked, broiled and Pork, cured, ham, boneless, extra lean (approximately 5% fat), roasted types in this article.
Infographic
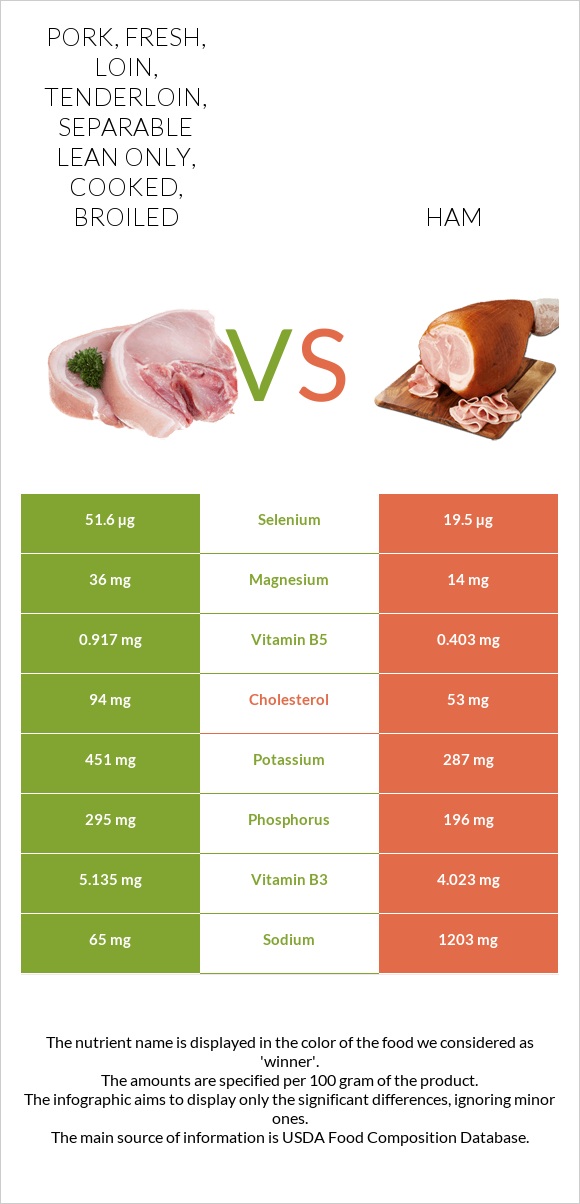
Infographic link
Mineral Comparison
The mineral comparison score is based on which food has a more favorable amount of each mineral. The �coverage� charts below show how much of the daily mineral needs are covered by the selected amount of each food.
| Contains more MagnesiumMagnesium | +157.1% |
| Contains more PotassiumPotassium | +57.1% |
| Contains more PhosphorusPhosphorus | +50.5% |
| Contains less SodiumSodium | -94.6% |
| Contains more SeleniumSelenium | +164.6% |
| Contains more CalciumCalcium | +60% |
| Contains more CopperCopper | +16.2% |
| Contains more ManganeseManganese | +350% |
Vitamin Comparison
The vitamin comparison score is based on the number of vitamins in which one food is richer than the other. The �coverage� charts below show how much of the daily vitamin needs are covered by the selected amount of each food.
| Contains more Vitamin CVitamin C | +∞% |
| Contains more Vitamin AVitamin A | +∞% |
| Contains more Vitamin B1Vitamin B1 | +31% |
| Contains more Vitamin B2Vitamin B2 | +91.6% |
| Contains more Vitamin B3Vitamin B3 | +27.6% |
| Contains more Vitamin B5Vitamin B5 | +127.5% |
| Contains more Vitamin B6Vitamin B6 | +32% |
| Contains more Vitamin B12Vitamin B12 | +53.8% |
| Contains more FolateFolate | +100% |
| Contains more Vitamin DVitamin D | +∞% |
| Contains more Vitamin EVitamin E | +∞% |
All nutrients comparison - raw data values
| Nutrient |  |
 |
DV% diff. |
| Selenium | 51.6µg | 19.5µg | 58% |
| Sodium | 65mg | 1203mg | 49% |
| Vitamin B1 | 0.988mg | 0.754mg | 20% |
| Protein | 30.42g | 20.93g | 19% |
| Vitamin B12 | 1µg | 0.65µg | 15% |
| Choline | 85.1mg | 15% | |
| Cholesterol | 94mg | 53mg | 14% |
| Phosphorus | 295mg | 196mg | 14% |
| Vitamin B2 | 0.387mg | 0.202mg | 14% |
| Vitamin B5 | 0.917mg | 0.403mg | 10% |
| Vitamin B6 | 0.528mg | 0.4mg | 10% |
| Vitamin B3 | 5.135mg | 4.023mg | 7% |
| Magnesium | 36mg | 14mg | 5% |
| Potassium | 451mg | 287mg | 5% |
| Vitamin D* | 32 IU | 4% | |
| Vitamin D | 0.8µg | 4% | |
| Calories | 187kcal | 145kcal | 2% |
| Vitamin E | 0.25mg | 2% | |
| Manganese | 0.012mg | 0.054mg | 2% |
| Saturated fat | 2.24g | 1.81g | 2% |
| Fats | 6.33g | 5.53g | 1% |
| Vitamin C | 1mg | 0mg | 1% |
| Carbs | 0g | 1.5g | 1% |
| Iron | 1.43mg | 1.48mg | 1% |
| Copper | 0.068mg | 0.079mg | 1% |
| Zinc | 2.95mg | 2.88mg | 1% |
| Folate | 6µg | 3µg | 1% |
| Protein per 100 calories | 16g | 14g | N/A |
| Calories per 10 g protein | 61kcal | 69kcal | N/A |
| Weight per 100 calories | 53g | 69g | N/A |
| Unsaturated / Saturated Fat ratio | 1.4 | 1.7 | N/A |
| Net carbs | 0g | 1.5g | N/A |
| Calcium | 5mg | 8mg | 0% |
| Vitamin A | 2µg | 0µg | 0% |
| Monounsaturated fat | 2.58g | 2.62g | 0% |
| Polyunsaturated fat | 0.56g | 0.54g | 0% |
| Tryptophan | 0.386mg | 0.251mg | 0% |
| Threonine | 1.389mg | 0.931mg | 0% |
| Isoleucine | 1.424mg | 0.918mg | 0% |
| Leucine | 2.441mg | 1.661mg | 0% |
| Lysine | 2.736mg | 1.775mg | 0% |
| Methionine | 0.805mg | 0.553mg | 0% |
| Phenylalanine | 1.214mg | 0.904mg | 0% |
| Valine | 1.65mg | 0.908mg | 0% |
| Histidine | 1.215mg | 0.75mg | 0% |
Macronutrient Comparison
Macronutrient breakdown side-by-side comparison
Protein:
30.42 g
Fats:
6.33 g
Carbs:
0 g
Water:
62.3 g
Other:
0.95 g
Protein:
20.93 g
Fats:
5.53 g
Carbs:
1.5 g
Water:
67.67 g
Other:
4.37 g
| Contains more ProteinProtein | +45.3% |
| Contains more FatsFats | +14.5% |
| Contains more CarbsCarbs | +∞% |
~equal in
Water
~67.67g
Fat Type Comparison
Fat type breakdown side-by-side comparison
Saturated fat:
Sat. Fat
2.24 g
Monounsaturated fat:
Mono. Fat
2.58 g
Polyunsaturated fat:
Poly. Fat
0.56 g
Saturated fat:
Sat. Fat
1.81 g
Monounsaturated fat:
Mono. Fat
2.62 g
Polyunsaturated fat:
Poly. Fat
0.54 g
| Contains less Sat. FatSaturated fat | -19.2% |
~equal in
Monounsaturated fat
~2.62g
~equal in
Polyunsaturated fat
~0.54g