Foodstruct Nutrition Search | Diet Analysis | Food Comparison | Glycemic Index Chart | Insulin Index Chart | Blog | Subscribe | Sign Up

Kidney beans vs. Cranberry beans — Health Impact and Nutrition Comparison

Compare
Article author photo Jack  Yacoubian by Jack Yacoubian | Last updated on June 29, 2023
Medically reviewed by Elen Khachatrian Article author photo Elen Khachatrian
Kidney beans
vs
Cranberry beans

Summary

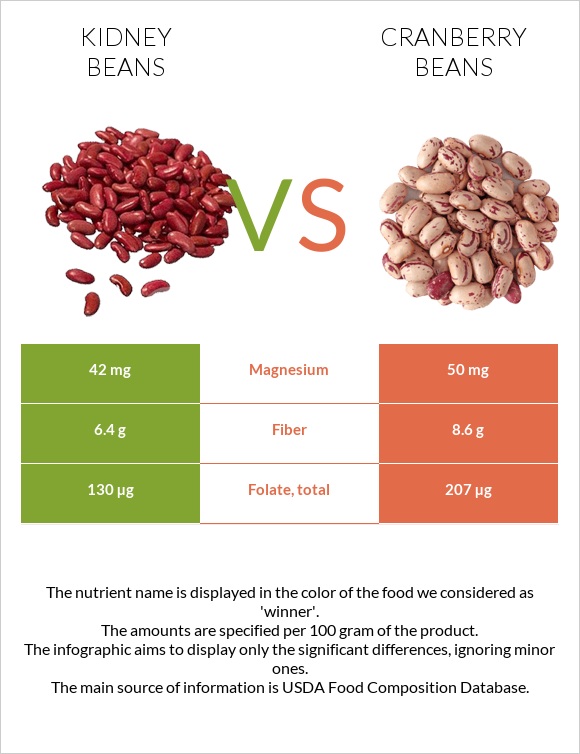
Cranberry beans are richer in fiber, magnesium, and folate. Meanwhile, kidney beans are richer in potassium, calcium, vitamin K, and vitamin B6.

Cranberry beans also provide more calories and protein than kidney beans.

Introduction

Cranberry beans and kidney beans belong to the beans family; however, a difference exists between them. This article will discuss the difference between these two beans on nutrition and health impacts.

Nutritional

In this comparison, we are considering 100g of raw beans in both cases.

Macronutrient Comparison

Macronutrient breakdown side-by-side comparison
Equal in Protein - 9.34
Equal in Fats - 0.46
Equal in Carbs - 24.46
Equal in Water - 64.65
Equal in Other - 1.09
9% 23% 67%
Protein: 8.67 g
Fats: 0.5 g
Carbs: 22.8 g
Water: 66.94 g
Other: 1.09 g
9% 24% 65%
Protein: 9.34 g
Fats: 0.46 g
Carbs: 24.46 g
Water: 64.65 g
Other: 1.09 g
Equal in Protein - 9.34
Equal in Fats - 0.46
Equal in Carbs - 24.46
Equal in Water - 64.65
Equal in Other - 1.09

Calories

Cranberry beans provide more calories than kidney beans. 

Carbs

Cranberry beans and kidney beans contain almost equal amounts of carbs.

Acidity

Kidney beans and cranberry beans have a similar pH value falling in the range of 5 to 6. 

Both beans have slightly alkaline PRAL values. Cranberry beans have a PRAL value equal to -0.5, while kidney beans have -0.7. This shows that both beans are considerably acid-producing in the body.

Fibers

Cranberry beans provide more fiber. They have 8.6g of fiber per 100g, while kidney beans have 6.4g.

Nearly 40% of the carbohydrate content of both beans is fiber.

Proteins

Cranberry beans are higher in protein. They have 9.34g, whereas kidney beans have 8.67g of protein per 100g.

Fats

Both beans contain negligible amounts of fats.

Minerals

Cranberry beans are richer in calcium and magnesium. Kidney beans are richer in potassium and phosphorus.

It is important to mention that the RDV% is satisfied for both beans for copper, phosphorus, potassium, magnesium, and iron.

In the diagram below, we can see the mineral distributions.

Mineral Comparison

Mineral comparison score is based on the number of minerals by which one or the other food is richer. The "coverage" charts below show how much of the daily needs can be covered by 300 grams of the food.
Contains more Manganese +16.2%
Contains more Calcium +42.9%
Contains more Magnesium +19%
Contains more Zinc +14%
Contains more Selenium +18.2%
Equal in Iron - 2.09
Equal in Phosphorus - 135
Equal in Potassium - 387
Equal in Sodium - 1
Equal in Copper - 0.231
Calcium Iron Magnesium Phosphorus Potassium Sodium Zinc Copper Manganese Selenium 11% 84% 30% 60% 36% 1% 28% 72% 57% 6%
Calcium Iron Magnesium Phosphorus Potassium Sodium Zinc Copper Manganese Selenium 15% 79% 36% 58% 35% 1% 32% 77% 49% 8%
Contains more Manganese +16.2%
Contains more Calcium +42.9%
Contains more Magnesium +19%
Contains more Zinc +14%
Contains more Selenium +18.2%
Equal in Iron - 2.09
Equal in Phosphorus - 135
Equal in Potassium - 387
Equal in Sodium - 1
Equal in Copper - 0.231

Vitamins

Cranberry beans are richer in folate. Kidney beans are richer in vitamin B6, and K.

In the diagram below, we can see the vitamin distributions.

Vitamin Comparison

Vitamin comparison score is based on the number of vitamins by which one or the other food is richer. The "coverage" charts below show how much of the daily needs can be covered by 300 grams of the food.
:
Contains more Vitamin C +∞%
Contains more Vitamin B3 +12.2%
Contains more Vitamin B6 +48.1%
Contains more Vitamin B1 +31.3%
Contains more Vitamin B2 +19%
Contains more Folate +59.2%
Equal in Vitamin B5 - 0.24
Vitamin A Vitamin E Vitamin D Vitamin C Vitamin B1 Vitamin B2 Vitamin B3 Vitamin B5 Vitamin B6 Folate Vitamin B12 Vitamin K 0% 1% 0% 4% 40% 14% 11% 14% 28% 98% 0% 22%
Vitamin A Vitamin E Vitamin D Vitamin C Vitamin B1 Vitamin B2 Vitamin B3 Vitamin B5 Vitamin B6 Folate Vitamin B12 Vitamin K 0% 0% 0% 0% 53% 16% 10% 15% 19% 156% 0% 0%
Contains more Vitamin C +∞%
Contains more Vitamin B3 +12.2%
Contains more Vitamin B6 +48.1%
Contains more Vitamin B1 +31.3%
Contains more Vitamin B2 +19%
Contains more Folate +59.2%
Equal in Vitamin B5 - 0.24

Health impacts

Although numerous health benefits are shared between cranberry and kidney beans, the main difference in their nutritional content is the vitamin K content of kidney beans. In this section, we will be focusing on the different health impacts rather than the similar ones.

Kidney beans are richer in vitamin K, which provides several positive health impacts.

Kidney bean consumption is linked with lower risks of cancer development and cardiovascular diseases, specifically the calcification of arteries. Kidney beans are also linked with decreased risks of osteoporosis. (1)

Article author photo Jack  Yacoubian
Education: Haigazian Medical University
Last updated: June 29, 2023
Medically reviewed by Elen Khachatrian

Infographic

Kidney beans vs Cranberry beans infographic
Infographic link

Fat Type Comparison

Fat type breakdown side-by-side comparison
Contains less Saturated Fat -38.7%
Contains more Polyunsaturated fat +39.7%
Equal in Monounsaturated Fat - 0.04
19% 10% 71%
Saturated Fat: 0.073 g
Monounsaturated Fat: 0.039 g
Polyunsaturated fat: 0.278 g
33% 11% 56%
Saturated Fat: 0.119 g
Monounsaturated Fat: 0.04 g
Polyunsaturated fat: 0.199 g
Contains less Saturated Fat -38.7%
Contains more Polyunsaturated fat +39.7%
Equal in Monounsaturated Fat - 0.04

Comparison summary table

Pay attention to the rightmost column. It displays the amounts side by side, giving a clearer understanding of the difference.
Kidney beans Cranberry beans
Lower in Saturated Fat ok
Lower in Glycemic Index ok
Lower in price ok
Lower in Sugar ok
Lower in Sodium Equal
Lower in Cholesterol Equal
Rich in minerals Equal
Rich in vitamins Equal

All nutrients comparison - raw data values

Nutrient Kidney beans Cranberry beans Opinion
Net carbs 16.4g 15.86g Kidney beans
Protein 8.67g 9.34g Cranberry beans
Fats 0.5g 0.46g Kidney beans
Carbs 22.8g 24.46g Cranberry beans
Calories 127kcal 136kcal Cranberry beans
Sugar 0.32g Cranberry beans
Fiber 6.4g 8.6g Cranberry beans
Calcium 35mg 50mg Cranberry beans
Iron 2.22mg 2.09mg Kidney beans
Magnesium 42mg 50mg Cranberry beans
Phosphorus 138mg 135mg Kidney beans
Potassium 405mg 387mg Kidney beans
Sodium 1mg 1mg
Zinc 1mg 1.14mg Cranberry beans
Copper 0.216mg 0.231mg Cranberry beans
Manganese 0.43mg 0.37mg Kidney beans
Selenium 1.1µg 1.3µg Cranberry beans
Vitamin E 0.03mg Kidney beans
Vitamin C 1.2mg 0mg Kidney beans
Vitamin B1 0.16mg 0.21mg Cranberry beans
Vitamin B2 0.058mg 0.069mg Cranberry beans
Vitamin B3 0.578mg 0.515mg Kidney beans
Vitamin B5 0.22mg 0.24mg Cranberry beans
Vitamin B6 0.12mg 0.081mg Kidney beans
Folate 130µg 207µg Cranberry beans
Vitamin K 8.4µg Kidney beans
Tryptophan 0.104mg 0.111mg Cranberry beans
Threonine 0.319mg 0.393mg Cranberry beans
Isoleucine 0.41mg 0.412mg Cranberry beans
Leucine 0.736mg 0.746mg Cranberry beans
Lysine 0.607mg 0.641mg Cranberry beans
Methionine 0.113mg 0.14mg Cranberry beans
Phenylalanine 0.511mg 0.505mg Kidney beans
Valine 0.5mg 0.489mg Kidney beans
Histidine 0.238mg 0.26mg Cranberry beans
Saturated Fat 0.073g 0.119g Kidney beans
Monounsaturated Fat 0.039g 0.04g Cranberry beans
Polyunsaturated fat 0.278g 0.199g Kidney beans

Which food is preferable for your diet?

ok
ok
is better in case of low diet
Kidney beans Cranberry beans
Low Fats diet ok
Low Carbs diet ok
Low Calories diet ok
Low Glycemic Index diet ok

People also compare

Vitamins & Minerals Daily Need Coverage Score

The summary scores indicate the extent to which this food can fulfill your daily vitamin and mineral requirements if you consume 3 servings, consisting of 100 grams of each (an approximation of 3 serving sizes).
Vitamins Daily Need Coverage Score
19%
Kidney beans
22%
Cranberry beans
Minerals Daily Need Coverage Score
38%
Kidney beans
38%
Cranberry beans

Comparison summary

Which food is lower in Saturated Fat?
Kidney beans
Kidney beans is lower in Saturated Fat (difference - 0.046g)
Which food is lower in glycemic index?
Kidney beans
Kidney beans is lower in glycemic index (difference - 13)
Which food is cheaper?
Kidney beans
Kidney beans is cheaper (difference - $1.2)
Which food is lower in Sugar?
Cranberry beans
Cranberry beans is lower in Sugar (difference - 0.32g)
Which food contains less Sodium?
?
The foods are relatively equal in Sodium (1 mg)
Which food contains less Cholesterol?
?
The foods are relatively equal in Cholesterol (0 mg)
Which food is richer in minerals?
?
It cannot be stated which food is richer in vitamins. See the charts below for detailed information. See the charts below for detailed information. See the charts below for detailed information.
Which food is richer in vitamins?
?
It cannot be stated which food is richer in vitamins. See the charts below for detailed information. See the charts below for detailed information. See the charts below for detailed information.

References

All the values for which the sources are not specified explicitly are taken from FDA’s Food Central. The exact link to the food presented on this page can be found below.

  1. Kidney beans - https://fdc.nal.usda.gov/fdc-app.html#/food-details/173740/nutrients
  2. Cranberry beans - https://fdc.nal.usda.gov/fdc-app.html#/food-details/173736/nutrients

All the Daily Values are presented for males aged 31-50, for 2000-calorie diets.

Data provided by FoodStruct.com should be considered and used as information only. Please consult your physician before beginning any diet.