Black Turtle Beans: In-Depth Nutrition, Health, & More
Summary
Cooked black turtle beans consist of 65.7% water and 34.3% nutrients. Black turtle beans contain 24.4g of carbohydrates, 8.3g of which constitutes dietary fiber, with a higher insoluble fiber content. They also contain 8.18g of high-quality proteins and 0.35g of fats.
Black turtle beans are rich in folate, vitamins B1 and E, copper, iron, magnesium, calcium, manganese, and phytochemical anthocyanin.
Table of contents
Introduction
The black turtle beans are a small, nutritious, and flavorful variety of the common bean popular in Latin American cuisine. From Latin America, these beans have traveled from West Africa to Southeast Asia and all across the world.
This article will discuss everything you need to know about the black turtle bean.
Names and Appearance
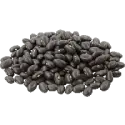
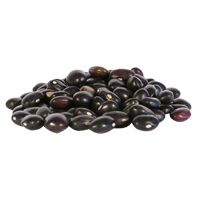
Black turtle beans are small, black or dark violet, oval or round, and glossy beans with white spots on one side.
In different cultures, black turtle beans have various names. In Latin America these beans can be called frijoles negros, judía negra, caviar criollo, zaragoza, poronto negro, caraota or habichuela negra. In Portuegese black turtle beans are named feijão preto. In Indian or Tamil cuisine, these beans are known as maa ki daal or karuppu karamani. In Maharashtrian culture, these beans are called Kala ghevada.
Black turtle beans are also known as black shelling beans or simply as black beans. However, black bean is a name that can be used for several other beans, such as black gram, black adzuki beans, or black soybeans.
Nutrition
Depending on the variety and cooking method of the black turtle beans, the nutritional values of these beans can slightly differ.
The nutritional information below will focus on mature seeds of black turtle beans, boiled without added salt, while also talking about canned black turtle seeds (1). As raw black turtle beans are considered toxic, they won't be discussed in this section.
Cooked black turtle beans consist of 65.7% water and 34.3% nutrients.
Canned black turtle beans, on the other hand, are less dense in nutrients, consisting of 75.6% water.
Macronutrients chart
Calories
Boiled black turtle seeds provide 130 calories per 100g serving. This puts black turtle seeds in the low-calorie category of foods.
A 100g serving size of canned black turtle beans provides only 91 calories.
The average serving size of these beans per person is 90g for boiled black turtle beans and 190g for canned beans. Consequently, one average serving size of boiled black beans provides 117 calories, and one average serving size of canned black turtle beans provides 118 calories.
Carbohydrates
A 100g serving of boiled black turtle beans contains 24.4g of carbohydrates. Of these carbohydrates, 8.3g constitute dietary fiber, and only 0.32g are sugars.
Other carbohydrates include resistant starch, as beans are considered to be “starchy vegetables” and oligosaccharides.
An equal amount of canned black turtle beans contains 16.6g of carbohydrates, of which dietary fiber makes up almost 7g.
Dietary Fiber
Black beans contain both soluble and insoluble fiber, with a greater percentage of insoluble fiber. The dietary fiber comprises 60.6% insoluble fiber and 39.4% soluble dietary fiber (2).
Fiber content ratio for Black turtle bean
FODMAPs
Black turtle beans, and beans in general, are high in FODMAPs, causing digestive discomfort. FODMAPs or fermentable oligosaccharides, disaccharides, monosaccharides, and polyols are carbs that the small intestine digests poorly.
The main FODMAPs in legumes are raffinose family oligosaccharides, which the human organism can not break down due to the lack of an enzyme called α-galactosidase (3).
Protein
Black turtle bean is a great source of protein, especially in diets low in meat and dairy.
A 100g of black turtle beans contains 8.18g of protein. This protein is considered to be of high quality, as it contains sufficient amounts of all essential amino acids.
The only essential amino acid that is relatively low in black turtle beans is methionine.
The same serving size of canned black turtle beans provides 6g of protein.
Protein quality breakdown
Fat
Black turtle beans are very low in fats overall. A hundred-gram serving of boiled black turtle beans provides only 0.35g of fats, and canned black turtle beans contain 0.29g.
Most of these fats consist of polyunsaturated fatty acids, followed by saturated fatty acids.
Naturally, as a plant product, the black turtle bean contains no cholesterol.
Vitamins
Black turtle beans are an excellent source of most B complex vitamins. These beans are particularly high in vitamin B9 or folate, vitamin B1, and vitamin E. Black turtle beans fall in the top 26% of foods as a source of folate and the top 32% of foods as a source of vitamin B1.
In sufficient amounts, other vitamins that can be found in black turtle beans include vitamin K, vitamin A, and vitamins B6, B5, B3, and B2.
Black turtle beans are absent in vitamins B12, C, and D.
Vitamin coverage chart
Minerals
Black turtle beans are incredibly rich in various minerals. These beans fall in the top 15% of foods as a source of potassium, containing more of this mineral than bananas or cucumber.
Black turtle beans are an excellent source of magnesium and iron, falling in the top 22% and 23% of foods, respectively, as a source of these minerals.
These beans also contain significant amounts of copper, calcium, and manganese. Moderate levels of phosphorus, zinc, selenium, and choline can also be found.
Black turtle beans are very low in sodium, containing only around 3mg in a hundred-gram serving.
Mineral coverage chart
Oxalates
There is no calculated value for black turtle beans. However, black beans are calculated to have 41 mg of oxalates per 100g serving (fresh weight), which is considered high.
Oxalates are generally safe for most people; however, some people are at risk of developing calcium oxalate kidney stones and are suggested to be on a low oxalate diet (4).
Phytochemicals
Phytochemicals or phytonutrients are biologically active compounds produced by plants, and black turtle beans are rich in the phytochemical anthocyanin. This compound belongs to a family of molecules called flavonoids. Anthocyanin is the pigment that gives the black turtle bean its distinct dark coloring.
One gram of dry extract of black beans was found to have 32mg of anthocyanins (5).
Anthocyanins are known for their strong antioxidant qualities. Antioxidants help protect cells from damage by inhibiting oxidation from free radicals.
Other antioxidant compounds found in black beans include antioxidant vitamins, such as vitamin A and vitamin E, phytochemicals myricetin, quercetin, and kaempferol (6). Higher consumption of foods rich in antioxidants and phytochemicals decreases the risk of chronic illnesses and cancer.
Glycemic Index
The glycemic index of common black beans from the Philippines that have been soaked overnight and cooked for 45 minutes has been calculated to be 20 (7).
While the specific number has not yet been calculated for the glycemic index value of black turtle beans, it can be assumed to fall in the low category.
Black turtle beans have also been researched to potentially benefit diabetic individuals by alleviating insulin resistance (8).
Acidity
The pH value of black beans, in general, has been calculated to fall in the range of 5.78 to 6.02 (9).
Another way of measuring food’s acidity is by looking at its potential renal acid load, which demonstrates how much acid or base the given food produces when already inside the gastrointestinal tract.
The PRAL value of black turtle beans has been calculated to be -1.4. The negative value shows that black turtle beans are acid-forming.
Serving Size
The average serving size of black turtle beans per person is 130g for beans in sauce or canned in liquid and refried beans prepared, 90g for beans prepared otherwise, and 35g for dry black gram beans (10).
Health Impact
For centuries, it has been known that the right diet can be essential in maintaining health and protecting from various diseases.
Now that everything about the nutrition of black turtle beans has been discussed, we can look at how the consumption of black beans affects health overall.
Health Benefits
Cardiovascular Health
Black beans contain various phytochemicals that can positively affect cardiovascular health. Black beans are also rich in dietary fiber and protein while low in fats.
High carbohydrate and high fiber meals have been researched to lead to a decreased level of a pro-inflammatory agent named interleukin-18. This compound, while relatively newfound, has been associated with metabolic syndrome and cardiovascular disease (11).
By improving insulin sensitivity and helping manage postprandial metabolic responses, black bean meals can contribute to metabolic health and delay cardiovascular disease and type 2 diabetes in adults with metabolic syndrome (11).
Regular consumption of pulses, such as black turtle beans, has been researched to reduce metabolic syndrome risk factors in overweight and obese adults by increasing high-density cholesterol levels, also known as “good” cholesterol, and decreasing waist circumference and systolic blood pressure (12).
Some evidence suggests that bean intake can reduce the risk of ischemic heart disease, likely due to its cholesterol-lowering qualities. Bean consumption has been associated with reduced levels of low-density lipoproteins, which are known as “bad” cholesterol (13).
Regular consumption of black beans, high in phytochemicals, also has the potential to be used as a natural agent to reduce blood pressure through the positive effects on vascular remodeling and stiffness (14).
Diabetes
Cooked black turtle bean supplementation in a high-fat diet has health-promoting lipid and glucose metabolism effects. A diet high in black turtle beans can lessen insulin resistance and lower plasma low-density lipoprotein levels (“bad” cholesterol) through a glucose signaling pathway in animals fed a high-fat diet (8).
A diet high in black turtle beans also had a significantly beneficial effect on diabetes-related biomarkers and inflammatory cytokines (8).
The anthocyanins found in black turtle beans have been studied to have the ability to lower postprandial glucose by inhibiting the activity of certain enzymes that break down carbohydrates into glucose, such as α-amylase, maltase, and sucrase (15).
A high intake of dietary anthocyanins has also been correlated with improved insulin sensitivity and decreased inflammation markers (16).
The extract of black beans has shown abilities to reduce postprandial glucose, insulin, and C-peptide levels, suppress the so-called “hunger hormone” ghrelin, increase satiety, and induce a lower desire to eat (17).
Cooked common beans may be able to protect against the damage of insulin-producing beta cells of the pancreas in drug-induced diabetic animals (18).
Cancer
Depending on various factors, the food you eat can either decrease or increase the risk of developing certain types of cancer. Black turtle beans, in particular, are rich in several antioxidants, which can help protect against cell damage, mutation, and cancer.
Black turtle beans have been studied to protect against human breast cancer cell lines. The extract of black turtle beans had apoptotic effects on the cancer cells by activating a pathway called caspase 3/7, leading to the cell’s programmed death. The extract also affected other programmed death pathways, increasing the expression of proapoptotic Bax regulating proteins and decreasing anti-apoptotic Bcl-2 and Bcl-xL proteins (19).
Black beans can also strengthen the immune system to recognize and terminate cancer cells and inhibit the development of new blood vessels, with such angiogenesis being necessary for the development of the tumor. Black beans reduce the metastatic potentials of cancer cells by weakening their adhesiveness and invasiveness (19).
Certain phenolic compounds, which black turtle beans are rich in, can play a role in decreasing the risk of developing colon cancer (6, 20). In addition, the dietary fiber that can be found in ample amounts in black turtle beans has also been extensively researched to protect against colorectal cancer (21).
A negative association has been found between a high intake of foods such as beans and a decreased risk of pancreatic cancer (22).
Anti-Inflammatory Effects
Consumption of black beans has been correlated with a decreased level of multiple inflammation markers.
Compared to a high-fat diet, a diet high in cooked black turtle beans resulted in significantly lower concentrations of inflammatory cytokines, particularly plasma interleukin-4, interleukin-5, interleukin-10, interleukin-12, interferon-γ, and tumor necrosis factor-α (8).
By reducing tumor necrosis factor-α concentrations, black turtle beans can also help reduce fat accumulation in the liver, called hepatic steatosis, as TNF-α plays a key role in its development (23).
Downsides and Risks
Allergy
Like any other food, black turtle beans contain compounds that can present as allergens in some people.
Legume allergies are not uncommon in adults. A legume allergy includes sensitization to beans, peas, lentils, and peanuts. Some people with legume allergies are hypersensitive to all foods of these groups, while others are allergic only to specific foods.
If allergic to one food in the legume family, the chances of being allergic to another food of the same family are higher due to cross-reactivity.
Symptoms of a black turtle bean allergy are the same as other food allergies: hives and rash, oral allergy syndrome (which includes swelling, redness, itching, or tingling of the mouth area), difficulty breathing, asthma, nausea and vomiting, abdominal pain, and in rare severe cases, anaphylactic shock. The allergy can sometimes present with contact dermatitis: hives, and rash after touching the bean.
A common allergen found in black turtle beans is the protein called lectin. Research has been carried out on ways to reduce the allergenicity of the lectin found in black turtle beans. Results have indicated that a low-pH treatment might be an efficient method to improve the safety of legume protein consumption (24).
Toxicity
Like most members of the common bean family, raw black turtle beans contain a significant amount of a toxic compound called phytohaemagglutinin, which belongs to the lectin family of proteins. However, the phytohaemagglutinin in black turtle beans can be detoxified simply by cooking the beans (8).
Research indicates that the toxin is destroyed when boiled at 212°F (100°C) for 10 minutes. Still, scientists recommend boiling for 30 minutes to ensure the beans reach the proper temperature for the amount of time necessary.
Using a slow cooker is not recommended as it may not reach a high enough temperature to deactivate the toxins (25).
As canned beans are already processed at a high temperature and pressure during production, they are safe to eat without cooking (26).
Symptoms of common bean poisoning include nausea, vomiting, and diarrhea within a few hours after eating the food.
Gastrointestinal Issues
As previously mentioned, beans are high in FODMAPs, mainly raffinose. Raffinose leaves the small intestine undigested and undergoes bacterial fermentation by colonic microbiota, causing a gas buildup in the intestines.
Thus, bean consumption is often associated with bloating, flatulence, and gastrointestinal discomfort. Bean consumption should be minimized in people with IBS and other gastrointestinal functional disorders, as well as inflammatory bowel disease.
The effect of beans on the gastrointestinal system is individual. Different people find different beans easier to digest.
However, soaking and boiling black turtle beans can decrease the content of raffinose oligosaccharides and, therefore, the risk of flatulence. Another way to reduce flatulence is by adding herbs, such as caraway, black cumin, ginger, and black anise (3).
Black Turtle Bean in Diets
Black turtle beans are high in calories and carbohydrates, providing 130 calories and 24g of carbohydrates per 100g serving. For this reason, black turtle beans usually do not fit well in low-calorie weight-loss diets.
However, this does not exclude black turtle beans from a healthy diet that can lead to weight loss. Black turtle beans are a great source of protein and dietary fiber while being very low in fats.
Animal studies have shown that a diet high in black turtle beans leads to a lesser weight gain than a high-fat diet (8).
A calorie-restricted weight loss diet high in legumes has been shown to lead to a greater weight reduction than a calorie-restricted weight loss diet without legumes. A low-calorie diet rich in legumes also demonstrated improved metabolic markers, such as lipid profile and blood pressure, in overweight or obese individuals (27).
| Keto | A keto diet allows up to 20g of carbohydrate consumption per day. One average serving size of black turtle beans provides 22g of carbohydrates; therefore, these beans are not a good option for the keto diet. |
| DASH | Black turtle beans are high in fiber, potassium, magnesium, and calcium while low in sodium, saturated fat, and sugar. Multiple studies have also researched pulses, particularly black beans, to have qualities that help reduce systolic blood pressure (12, 14). Black turtle beans can certainly be used on a DASH diet. |
| Atkins | Black turtle beans should be avoided during the first two phases of the Atkins diet - Induction and Balancing, as they are high in carbohydrates. These beans can be slowly reintroduced to the diet during the third Pre-maintenance phase and used in moderation throughout the fourth Maintenance phase. |
| Mediterranean | While black turtle beans originated in North America, beans and legumes are generally important in the Mediterranean diet. Black turtle beans can be used on this diet. |
| Paleo | Beans and legumes are often excluded from the paleo diet, as they are high in toxic compounds, such as phytic acid and lectins (28). For this reason, black turtle beans are not considered to be paleo. |
| Vegan/ Vegetarian/ Pescetarian | Due to its high protein content and meaty texture, the black turtle bean is often used in vegan and vegetarian foods. Naturally, being a plant product, these beans also fit into a pescetarian diet. |
| Gluten-free | Black turtle beans are naturally gluten-free and can be a good source of protein, vitamins, and minerals on a gluten-free diet. |
| Dukan | The Dukan diet discourages the consumption of black beans as they are relatively high in starch. One or two servings of black turtle beans can be added to the diet as a starchy food during the Consolidation phase. During the Stabilization phase, black turtle beans can be consumed in moderation. |
| Intermittent Fasting | Like all foods, black turtle beans can be used on this diet during eating periods but should be refrained from during fasting periods. |
| Low Fat & Low Calorie | Black turtle beans are naturally very low in fats. However, 100g of cooked black turtle beans provides 130 calories. Therefore, these beans are suited for low-fat and low-calorie diets. |
| Low Carb | Despite the high dietary fiber content, providing 22g of carbohydrates per serving, black turtle beans are advised to be avoided on a low-carb diet. |
| Anti Inflammatory | Black turtle beans are rich in antioxidants, such as anthocyanin and other phytochemicals. As discussed previously, the consumption of cooked black turtle beans has been correlated with reduced concentrations of multiple proinflammatory agents (8, 23). For these reasons, black turtle beans can be a good addition to the anti-inflammatory diet. |
| BRAT | Black turtle beans are not considered a bland food, as they are high in insoluble fiber and can cause bloating and worsening of symptoms in some people. Black turtle beans should be avoided on a BRAT diet. |
Cooking and Use
Black turtle beans are popular in national dishes throughout the South and Central Americas.
Black turtle beans are versatile in the kitchen and can be boiled, canned, refried, pureed, baked, etc. Black beans can also be added to a salad or used to make a dip.
Black turtle beans, having a mild taste and a soft texture, are used as an ingredient in many dishes. In Mexican cuisine, black turtle beans are often used in burritos, tacos, and enchiladas. In Brazillian cuisine, black turtle beans are used to make the national dish feijoada. Refried black beans are popular in Guatemala, while Venezuelan cuisine uses black turtle beans for the soup called sopa de frijoles negros (29).
Before use, dry black turtle beans can be soaked overnight by adding three cups of water to one cup of black beans and optionally adding a teaspoon of salt. This makes the cooking process faster the next day.
Beans can also be soaked quickly before use by boiling the beans soaked in water for two minutes and letting them rest for two hours. However, this soaking method can break down the beans during the cooking process.
The actual cooking process of the beans includes bringing the pot of black turtle beans with water to a boil and letting it simmer for around two hours while stirring.
Storage, Keeping, and Conservation
Dry black turtle beans should be kept in a dark, dry, and cool place and in airtight containers. In these conditions, black beans can be kept for up to a year. Older beans, while safe, can take longer to cook.
Canned beans should also be stored in a cool, dry space before opening. Open canned beans should be stored in the fridge.
After being cooked, black turtle beans should be kept in the refrigerator for three to five days. Cooked black turtle beans can also be frozen for longer storage. Frozen black turtle beans can stay in the freezer for 6 months.
Classification
Black turtle beans are a variety of common beans belonging to the Phaseolus vulgaris species and the Fabaceae family.
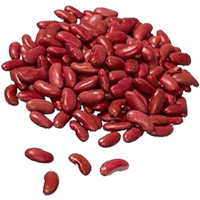
The common bean, also known as the French bean, is an annual herb native to the Americas. Black beans share this species with other widely popular beans, such as kidney beans, navy beans, and pinto beans.
The Fabaceae family that the black turtle bean belongs to is also called the legume, pea, or bean family and includes thousands of various other species, including beans, soybeans, peas, chickpeas, peanuts, and others.
Comparison Table of Various Beans
The comparison table below is calculated for 100g of each bean.
| Calories | Protein | Fat | Total Carbs | Fiber | |
| Black Turtle | 130 | 8.18g | 0.35g | 24.35g | 8.3g |
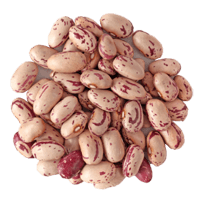
| Pinto | 143 | 9.0g | 0.65g | 26.22g | 9g |
| Fava | 110 | 7.6g | 0.4g | 19.65g | 5.4g |
| Kidney | 127 | 8.67g | 0.5g | 22.8g | 6.4g |
| Adzuki | 128 | 7.52g | 0.1g | 24.77g | 7.3g |
| Navy | 140 | 8.23g | 0.62g | 26.05g | 10.5g |
| Great Northern | 118 | 8.33g | 0.45g | 21.09g | 7g |
| Black Eyes | 116 | 7.73g | 0.53g | 20.76g | 6.5g |
Cultivation
Black turtle beans are known as dry beans, shelled beans, or field beans, as they are harvested in shells when dry. The Phaseolus vulgaris plant has ovate-triangular leaves and can grow up to 20 inches (51cm).
This plant grows best in full sun, in well-drained and warm soil. The black turtle bean plant prefers slightly acidic to neutral soil with a pH of around 7 (30).
The maturing of the Phaseolus vulgaris plant takes from 60 to 90 days (30).
Production and Consumption
Common beans are considered one of the most important protein sources, especially in North America, Latin America, Asia-Pacific, and several parts of Africa.
According to the U.N. FAOSTAT, global bean production shot up in 2011 and has been growing ever since (29).
Parts of the reason for the growth of bean consumption worldwide is that environmentally aware consumers switch meat for beans out of ethical and ecological reasons.
Major common bean-producing regions are found in all parts of Africa, Southeast Asia, Europe, and the Andean (29).
Despite the nutritional and economic importance of common beans, they have turned out to be a low-yielding crop in African and Latin American regions (29).
References
- https://fdc.nal.usda.gov/fdc-app.html#/food-details/175188/nutrients
- Table 9. [Fiber Content of Selected Legumes*]. - Endotext - NCBI Bookshelf
- https://d-nb.info/121334915X/34
- https://www.sciencedirect.com/science/article/abs/pii/S0889157513000902
- https://www.researchgate.net/publication/314093996
- https://www.researchgate.net/publication/345741883
- https://care.diabetesjournals.org/content/diacare/suppl/2008/09/18/dc08-1239.DC1/TableA1_1.pdf
- https://www.mdpi.com/2304-8158/10/8/1691/pdf
- pH values of foods and food products
- https://www.fda.gov/media/102587/download
- https://www.ncbi.nlm.nih.gov/pmc/articles/PMC4555112/
- https://pubmed.ncbi.nlm.nih.gov/22916807/
- https://academic.oup.com/ajcn/article/100/suppl_1/437S/4576589
- https://pubmed.ncbi.nlm.nih.gov/32138293/
- https://pubmed.ncbi.nlm.nih.gov/23180627/
- https://pubmed.ncbi.nlm.nih.gov/24336456/
- https://pubmed.ncbi.nlm.nih.gov/23046862/
- https://pubmed.ncbi.nlm.nih.gov/23595343/
- https://bmcchem.biomedcentral.com/articles/10.1186/s13065-017-0281-5
- https://onlinelibrary.wiley.com/doi/10.1111/j.1750-3841.2007.00625.x
- https://www.ncbi.nlm.nih.gov/pmc/articles/PMC5302293/
- https://pubmed.ncbi.nlm.nih.gov/3365678/
- https://pubs.rsc.org/en/content/articlelanding/2020/fo/d0fo02258f
- https://pubmed.ncbi.nlm.nih.gov/33464885/
- https://u.osu.edu/chowline/tag/phytohaemagglutinin/
- Killer Kidney Beans?
- https://link.springer.com/article/10.1007/s00394-010-0115-x
- https://thepaleodiet.com/beans-and-legumes-are-they-paleo
- https://www.transparencymarketresearch.com/black-turtle-beans-market.html
- https://www.uvm.edu/sites/default/files/media/NEDryBeanProductionGuide2016.pdf

Important nutritional characteristics for Black turtle bean
|
Glycemic index ⓘ
Source: The GI of black beans. https://www.sciencedirect.com/science/article/pii/S0002916522004944
Check out our Glycemic index chart page for the full list.
|
20 (low) |
| Glycemic load | 6 (low) |
| Calories ⓘ Calories per 100-gram serving | 130 |
| Net Carbs ⓘ Net Carbs = Total Carbohydrates – Fiber – Sugar Alcohols | 16.05 grams |
| Serving Size ⓘ Serving sizes are taken from FDA's Reference Amounts Customarily Consumed (RACCs) | 1 cup (185 grams) |
| Acidity (Based on PRAL) ⓘ PRAL (Potential renal acid load) is calculated using a formula. On the PRAL scale the higher the positive value, the more is the acidifying effect on the body. The lower the negative value, the higher the alkalinity of the food. 0 is neutral. | -1.4 (alkaline) |
| Oxalates ⓘ https://www.sciencedirect.com/science/article/abs/pii/S0889157513000902 | 41mg |
Black turtle bean calories (kcal)
| Serving Size | Calories | Weight |
|---|---|---|
| Calories in 100 grams | 130 | |
| Calories in 1 cup | 241 | 185 g |
Black turtle bean Glycemic index (GI)
Black turtle bean Glycemic load (GL)
Mineral chart - relative view
Vitamin chart - relative view
Fat type information
All nutrients for Black turtle bean per 100g
| Nutrient | Value | DV% | In TOP % of foods | Comparison |
| Calories | 130kcal | 7% | 65% |
2.8 times more than Orange
|
| Protein | 8.18g | 19% | 50% |
2.9 times more than Broccoli
|
| Fats | 0.35g | 1% | 83% |
95.2 times less than Cheddar Cheese
|
| Vitamin C | 0mg | 0% | 100% |
N/A
|
| Net carbs | 16.05g | N/A | 36% |
3.4 times less than Chocolate
|
| Carbs | 24.35g | 8% | 30% |
1.2 times less than Rice
|
| Cholesterol | 0mg | 0% | 100% |
N/A
|
| Vitamin D | 0µg | 0% | 100% |
N/A
|
| Iron | 2.85mg | 36% | 23% |
1.1 times more than Beef broiled
|
| Calcium | 55mg | 6% | 32% |
2.3 times less than Milk
|
| Potassium | 433mg | 13% | 15% |
2.9 times more than Cucumber
|
| Magnesium | 49mg | 12% | 22% |
2.9 times less than Almond
|
| Sugar | 0.32g | N/A | 73% |
28 times less than Coca-Cola
|
| Fiber | 8.3g | 33% | 13% |
3.5 times more than Orange
|
| Copper | 0.27mg | 30% | 26% |
1.9 times more than Shiitake
|
| Zinc | 0.76mg | 7% | 59% |
8.3 times less than Beef broiled
|
| Phosphorus | 152mg | 22% | 52% |
1.2 times less than Chicken meat
|
| Sodium | 3mg | 0% | 94% |
163.3 times less than White Bread
|
| Vitamin A | 6IU | 0% | 69% |
2784.3 times less than Carrot
|
| Vitamin A RAE | 0µg | 0% | 100% | |
| Vitamin E | 0.87mg | 6% | 49% |
1.7 times less than Kiwifruit
|
| Selenium | 1.2µg | 2% | 81% | |
| Manganese | 0.33mg | 14% | 43% | |
| Vitamin B1 | 0.23mg | 19% | 32% |
1.2 times less than Pea raw
|
| Vitamin B2 | 0.06mg | 4% | 79% |
2.3 times less than Avocado
|
| Vitamin B3 | 0.53mg | 3% | 77% |
18.2 times less than Turkey meat
|
| Vitamin B5 | 0.26mg | 5% | 77% |
4.3 times less than Sunflower seed
|
| Vitamin B6 | 0.08mg | 6% | 70% |
1.5 times less than Oat
|
| Vitamin B12 | 0µg | 0% | 100% |
N/A
|
| Vitamin K | 3.3µg | 3% | 60% |
30.8 times less than Broccoli
|
| Folate | 86µg | 22% | 26% |
1.4 times more than Brussels sprout
|
| Trans Fat | 0g | N/A | 100% |
N/A
|
| Saturated Fat | 0.09g | 0% | 82% |
66.2 times less than Beef broiled
|
| Monounsaturated Fat | 0.03g | N/A | 87% |
326.6 times less than Avocado
|
| Polyunsaturated fat | 0.15g | N/A | 82% |
316.6 times less than Walnut
|
| Tryptophan | 0.1mg | 0% | 79% |
3.1 times less than Chicken meat
|
| Threonine | 0.34mg | 0% | 77% |
2.1 times less than Beef broiled
|
| Isoleucine | 0.36mg | 0% | 78% |
2.5 times less than Salmon raw
|
| Leucine | 0.65mg | 0% | 79% |
3.7 times less than Tuna Bluefin
|
| Lysine | 0.56mg | 0% | 75% |
1.2 times more than Tofu
|
| Methionine | 0.12mg | 0% | 81% |
1.3 times more than Quinoa
|
| Phenylalanine | 0.44mg | 0% | 77% |
1.5 times less than Egg
|
| Valine | 0.43mg | 0% | 78% |
4.7 times less than Soybean raw
|
| Histidine | 0.23mg | 0% | 78% |
3.3 times less than Turkey meat
|
| Omega-3 - EPA | 0g | N/A | 100% |
N/A
|
| Omega-3 - DHA | 0g | N/A | 100% |
N/A
|
| Omega-3 - DPA | 0g | N/A | 100% |
N/A
|
Check out similar food or compare with current
NUTRITION FACTS LABEL
Serving Size ______________
Health checks
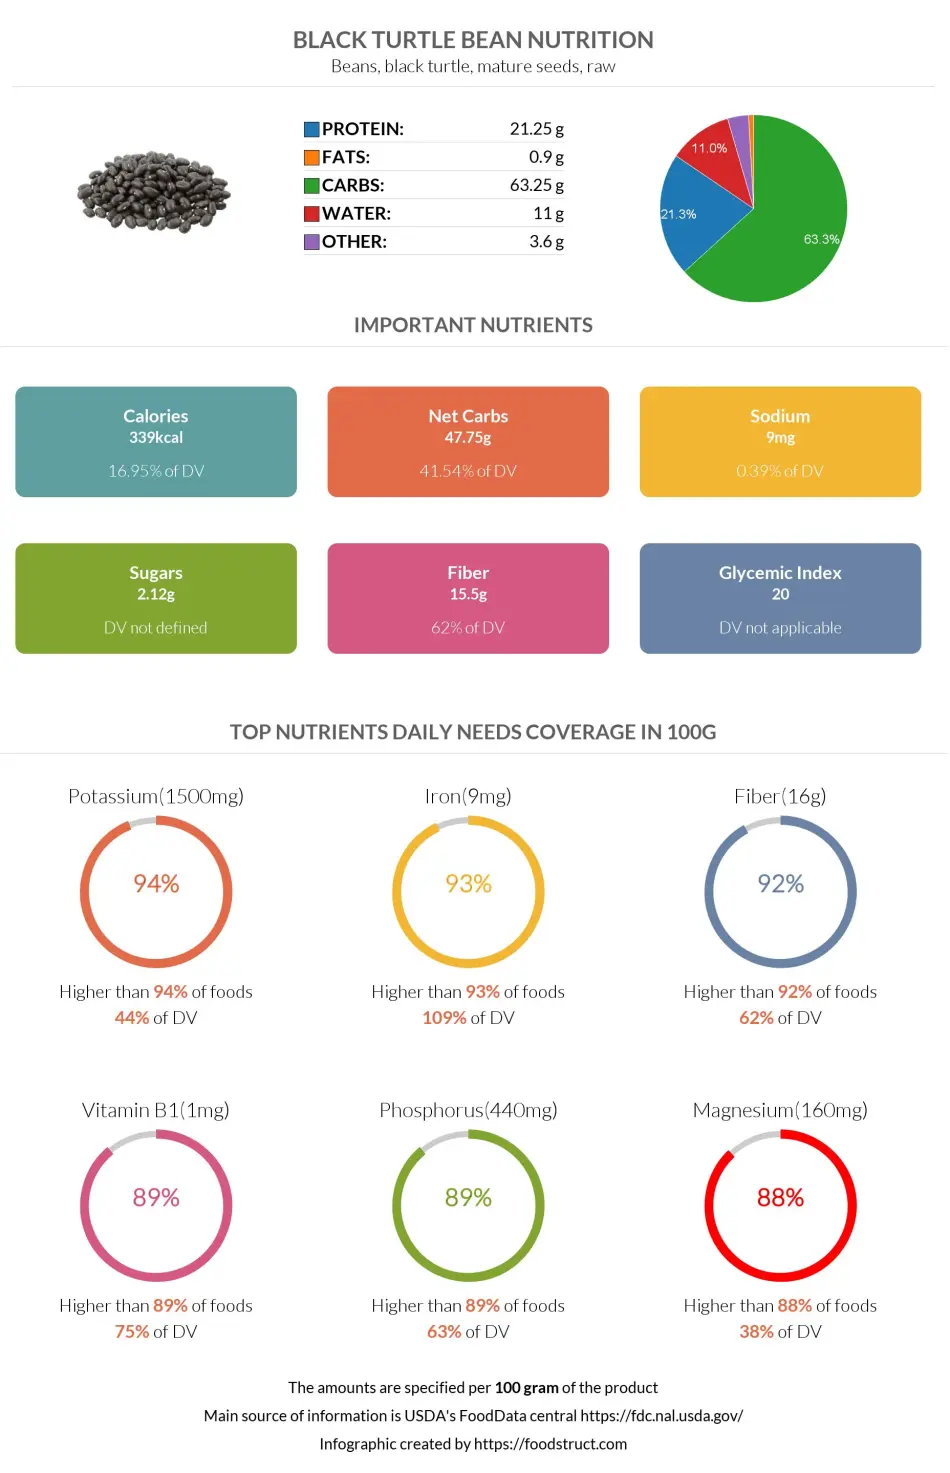
Black turtle bean nutrition infographic
References
All the values for which the sources are not specified explicitly are taken from FDA’s Food Central. The exact link to the food presented on this page can be found below.