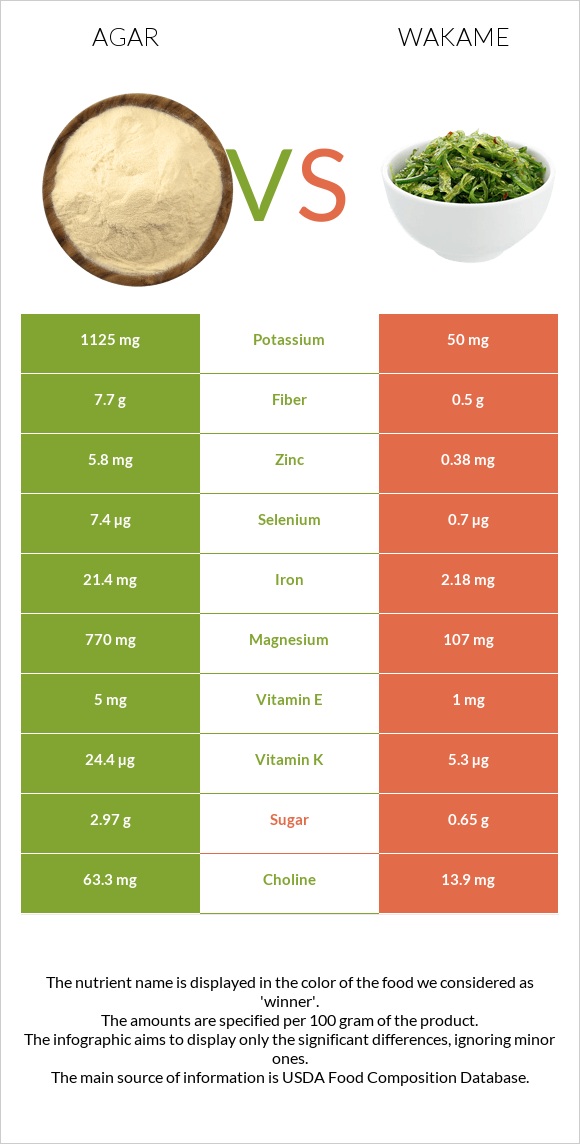
Important differences between agar and wakame Wakame has less iron, magnesium, manganese, folate, zinc, calcium, vitamin B5, copper, and potassium. Agar's daily need coverage for iron is 240% more. Agar has 23 times more potassium than wakame. Agar has 1125mg of potassium, while wakame has 50mg. Agar is lower in sodium. The food varieties used in the comparison are Seaweed, agar, dried and Seaweed, wakame, raw .
Infographic
Mineral Comparison
Mineral comparison score is based on the number of minerals by which one or the other food is richer. The "coverage" charts below show how much of the daily needs can be covered by 300 grams of the food.
9
100 g
300 g
Magnesium
Magnesium
Calcium
Calcium
Potassium
Potassium
Iron
Iron
Copper
Copper
Zinc
Zinc
Phosphorus
Phosphorus
Sodium
Sodium
Manganese
Manganese
Selenium
Selenium
550%
188%
99%
803%
203%
158%
22%
13%
561%
40%
1
100 g
300 g
2 tbsp (1/8 cup) - 10g
Magnesium
Magnesium
Calcium
Calcium
Potassium
Potassium
Iron
Iron
Copper
Copper
Zinc
Zinc
Phosphorus
Phosphorus
Sodium
Sodium
Manganese
Manganese
Selenium
Selenium
76%
45%
4.4%
82%
95%
10%
34%
114%
183%
3.8%
Vitamin Comparison
Vitamin comparison score is based on the number of vitamins by which one or the other food is richer. The "coverage" charts below show how much of the daily needs can be covered by 300 grams of the food.
5
100 g
300 g
Vitamin C
Vit. C
Vitamin D
Vit. D
Vitamin A
Vit. A
Vitamin E
Vit. E
Vitamin B1
Vit. B1
Vitamin B2
Vit. B2
Vitamin B3
Vit. B3
Vitamin B5
Vit. B5
Vitamin B6
Vit. B6
Vitamin B12
Vit. B12
Vitamin K
Vit. K
Folate
Folate
0%
0%
0%
100%
2.5%
51%
3.8%
181%
70%
0%
61%
435%
4
100 g
300 g
2 tbsp (1/8 cup) - 10g
Vitamin C
Vit. C
Vitamin D
Vit. D
Vitamin A
Vit. A
Vitamin E
Vit. E
Vitamin B1
Vit. B1
Vitamin B2
Vit. B2
Vitamin B3
Vit. B3
Vitamin B5
Vit. B5
Vitamin B6
Vit. B6
Vitamin B12
Vit. B12
Vitamin K
Vit. K
Folate
Folate
10%
0%
6%
20%
15%
53%
30%
42%
0.46%
0%
13%
147%
All nutrients comparison - raw data values
Nutrient
DV% diff.
Iron
21.4mg
2.18mg
240%
Magnesium
770mg
107mg
158%
Manganese
4.3mg
1.4mg
126%
Folate
580µg
196µg
96%
Zinc
5.8mg
0.38mg
49%
Calcium
625mg
150mg
48%
Vitamin B5
3.018mg
0.697mg
46%
Copper
0.61mg
0.284mg
36%
Sodium
102mg
872mg
33%
Potassium
1125mg
50mg
32%
Fiber
7.7g
0.5g
29%
Vitamin E
5mg
1mg
27%
Carbs
80.88g
9.14g
24%
Vitamin B6
0.303mg
0.002mg
23%
Vitamin K
24.4µg
5.3µg
16%
Calories
306kcal
45kcal
13%
Selenium
7.4µg
0.7µg
12%
Vitamin B3
0.202mg
1.6mg
9%
Choline
63.3mg
13.9mg
9%
Protein
6.21g
3.03g
6%
Phosphorus
52mg
80mg
4%
Vitamin B1
0.01mg
0.06mg
4%
Vitamin C
0mg
3mg
3%
Vitamin A
0µg
18µg
2%
Fats
0.3g
0.64g
1%
Vitamin B2
0.222mg
0.23mg
1%
Polyunsaturated fat
0.102g
0.218g
1%
Protein per 100 calories
2g
6.7g
N/A
Calories per 10 g protein
493kcal
149kcal
N/A
Weight per 100 calories
33g
222g
N/A
Net carbs
73.18g
8.64g
N/A
Sugar
2.97g
0.65g
N/A
Saturated fat
0.061g
0.13g
0%
Monounsaturated fat
0.027g
0.058g
0%
Tryptophan
0.035mg
0%
Threonine
0.165mg
0%
Isoleucine
0.087mg
0%
Leucine
0.257mg
0%
Lysine
0.112mg
0%
Methionine
0.063mg
0%
Phenylalanine
0.112mg
0%
Valine
0.209mg
0%
Histidine
0.015mg
0%
Omega-3 - EPA
0.087g
0.186g
N/A
Macronutrient Comparison
Macronutrient breakdown side-by-side comparison
2
6%
81%
9%
4%
Protein:
6.21 g
Fats:
0.3 g
Carbs:
80.88 g
Water:
8.68 g
Other:
3.93 g
3
3%
9%
80%
7%
Protein:
3.03 g
Fats:
0.64 g
Carbs:
9.14 g
Water:
79.99 g
Other:
7.2 g
Contains
more
Protein Protein
+105%
Contains
more
Carbs Carbs
+784.9%
Contains
more
Fats Fats
+113.3%
Contains
more
Water Water
+821.5%
Contains
more
Other Other
+83.2%
Fat Type Comparison
Fat type breakdown side-by-side comparison
1
32%
14%
54%
Saturated fat:
Sat. Fat
0.061 g
Monounsaturated fat:
Mono. Fat
0.027 g
Polyunsaturated fat:
Poly. Fat
0.102 g
2
32%
14%
54%
Saturated fat:
Sat. Fat
0.13 g
Monounsaturated fat:
Mono. Fat
0.058 g
Polyunsaturated fat:
Poly. Fat
0.218 g
Contains
less
Sat. Fat Saturated fat
-53.1%
Contains
more
Mono. Fat Monounsaturated fat
+114.8%
Contains
more
Poly. Fat Polyunsaturated fat
+113.7%