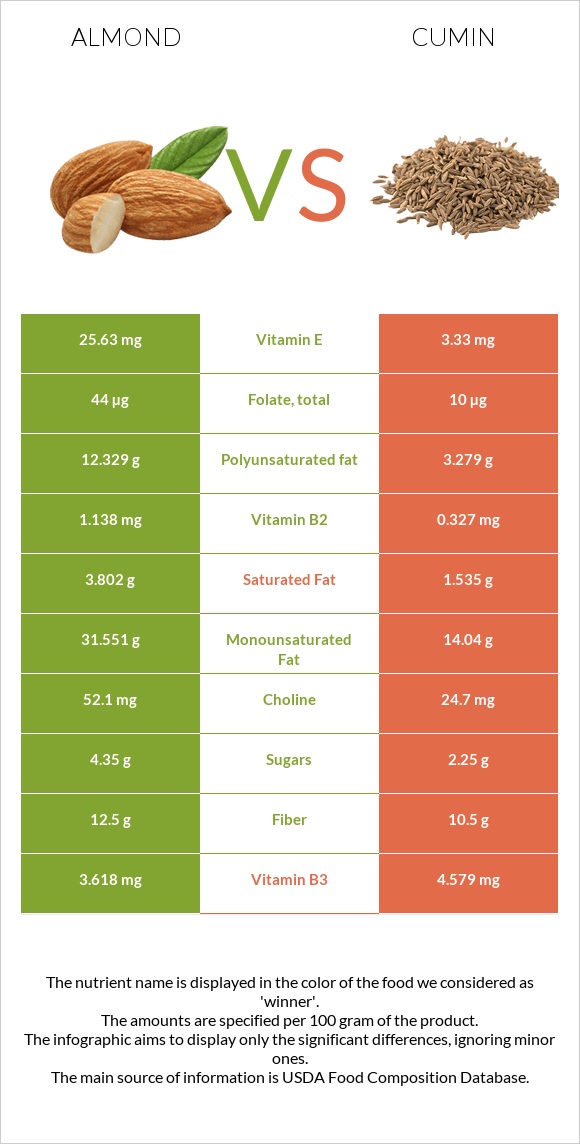
A recap on the differences between almonds and cumin Almonds have more vitamin E and vitamin B2; however, cumin is higher in iron, calcium, manganese, vitamin B1, potassium, vitamin A, vitamin B6, and magnesium. Cumin covers your daily iron needs 783% more than almonds. Cumin contains 8 times less vitamin E than almonds. Almonds contain 25.63mg of vitamin E, while cumin contains 3.33mg. Food varieties used in this article are Nuts, almonds and Spices, cumin seed .
Infographic
Mineral Comparison
Mineral comparison score is based on the number of minerals by which one or the other food is richer. The "coverage" charts below show how much of the daily needs can be covered by 300 grams of the food.
2
100 g
300 g
1 almond - 1.2g 1 oz (23 whole kernels) - 28.35g 1 cup, sliced - 92g 1 cup, ground - 95g 1 cup, slivered - 108g 1 cup, whole - 143g
Magnesium
Magnesium
Calcium
Calcium
Potassium
Potassium
Iron
Iron
Copper
Copper
Zinc
Zinc
Phosphorus
Phosphorus
Sodium
Sodium
Manganese
Manganese
Selenium
Selenium
193%
81%
65%
139%
344%
85%
206%
0.13%
284%
22%
7
100 g
300 g
0.25 tsp, whole - 0.5g 1 tbsp, whole - 6g
Magnesium
Magnesium
Calcium
Calcium
Potassium
Potassium
Iron
Iron
Copper
Copper
Zinc
Zinc
Phosphorus
Phosphorus
Sodium
Sodium
Manganese
Manganese
Selenium
Selenium
261%
279%
158%
2489%
289%
131%
214%
22%
435%
28%
Vitamin Comparison
Vitamin comparison score is based on the number of vitamins by which one or the other food is richer. The "coverage" charts below show how much of the daily needs can be covered by 300 grams of the food.
4
100 g
300 g
1 almond - 1.2g 1 oz (23 whole kernels) - 28.35g 1 cup, sliced - 92g 1 cup, ground - 95g 1 cup, slivered - 108g 1 cup, whole - 143g
Vitamin C
Vit. C
Vitamin D
Vit. D
Vitamin A
Vit. A
Vitamin E
Vit. E
Vitamin B1
Vit. B1
Vitamin B2
Vit. B2
Vitamin B3
Vit. B3
Vitamin B5
Vit. B5
Vitamin B6
Vit. B6
Vitamin B12
Vit. B12
Vitamin K
Vit. K
Folate
Folate
0%
0%
0%
513%
51%
263%
68%
28%
32%
0%
0%
33%
6
100 g
300 g
0.25 tsp, whole - 0.5g 1 tbsp, whole - 6g
Vitamin C
Vit. C
Vitamin D
Vit. D
Vitamin A
Vit. A
Vitamin E
Vit. E
Vitamin B1
Vit. B1
Vitamin B2
Vit. B2
Vitamin B3
Vit. B3
Vitamin B5
Vit. B5
Vitamin B6
Vit. B6
Vitamin B12
Vit. B12
Vitamin K
Vit. K
Folate
Folate
26%
0%
21%
67%
157%
75%
86%
0%
100%
0%
14%
7.5%
All nutrients comparison - raw data values
Nutrient
DV% diff.
Iron
3.71mg
66.36mg
783%
Vitamin E
25.63mg
3.33mg
149%
Calcium
269mg
931mg
66%
Vitamin B2
1.138mg
0.327mg
62%
Polyunsaturated fat
12.329g
3.279g
60%
Manganese
2.179mg
3.333mg
50%
Monounsaturated fat
31.551g
14.04g
44%
Fats
49.93g
22.27g
43%
Vitamin B1
0.205mg
0.628mg
35%
Potassium
733mg
1788mg
31%
Magnesium
270mg
366mg
23%
Vitamin B6
0.137mg
0.435mg
23%
Copper
1.031mg
0.867mg
18%
Zinc
3.12mg
4.8mg
15%
Calories
579kcal
375kcal
10%
Saturated fat
3.802g
1.535g
10%
Vitamin C
0mg
7.7mg
9%
Vitamin B5
0.471mg
9%
Folate
44µg
10µg
9%
Carbs
21.55g
44.24g
8%
Fiber
12.5g
10.5g
8%
Protein
21.15g
17.81g
7%
Sodium
1mg
168mg
7%
Vitamin A
0µg
64µg
7%
Vitamin B3
3.618mg
4.579mg
6%
Vitamin K
0µg
5.4µg
5%
Choline
52.1mg
24.7mg
5%
Phosphorus
481mg
499mg
3%
Selenium
4.1µg
5.2µg
2%
Protein per 100 calories
3.7g
4.7g
N/A
Calories per 10 g protein
274kcal
211kcal
N/A
Weight per 100 calories
17g
27g
N/A
Unsaturated / Saturated Fat ratio
12
11
N/A
Net carbs
9.05g
33.74g
N/A
Sugar
4.35g
2.25g
N/A
Starch
0.72g
0%
Trans fat
0.015g
N/A
Tryptophan
0.211mg
0%
Threonine
0.601mg
0%
Isoleucine
0.751mg
0%
Leucine
1.473mg
0%
Lysine
0.568mg
0%
Methionine
0.157mg
0%
Phenylalanine
1.132mg
0%
Valine
0.855mg
0%
Histidine
0.539mg
0%
Fructose
0.11g
0%
Omega-3 - ALA
0.003g
N/A
Omega-6 - Eicosadienoic acid
0.002g
N/A
Omega-6 - Linoleic acid
12.32g
N/A
Macronutrient Comparison
Macronutrient breakdown side-by-side comparison
2
21%
50%
22%
4%
3%
Protein:
21.15 g
Fats:
49.93 g
Carbs:
21.55 g
Water:
4.41 g
Other:
2.96 g
3
18%
22%
44%
8%
8%
Protein:
17.81 g
Fats:
22.27 g
Carbs:
44.24 g
Water:
8.06 g
Other:
7.62 g
Contains
more
Protein Protein
+18.8%
Contains
more
Fats Fats
+124.2%
Contains
more
Carbs Carbs
+105.3%
Contains
more
Water Water
+82.8%
Contains
more
Other Other
+157.4%
Fat Type Comparison
Fat type breakdown side-by-side comparison
2
8%
66%
26%
Saturated fat:
Sat. Fat
3.802 g
Monounsaturated fat:
Mono. Fat
31.551 g
Polyunsaturated fat:
Poly. Fat
12.329 g
1
8%
74%
17%
Saturated fat:
Sat. Fat
1.535 g
Monounsaturated fat:
Mono. Fat
14.04 g
Polyunsaturated fat:
Poly. Fat
3.279 g
Contains
more
Mono. Fat Monounsaturated fat
+124.7%
Contains
more
Poly. Fat Polyunsaturated fat
+276%
Contains
less
Sat. Fat Saturated fat
-59.6%