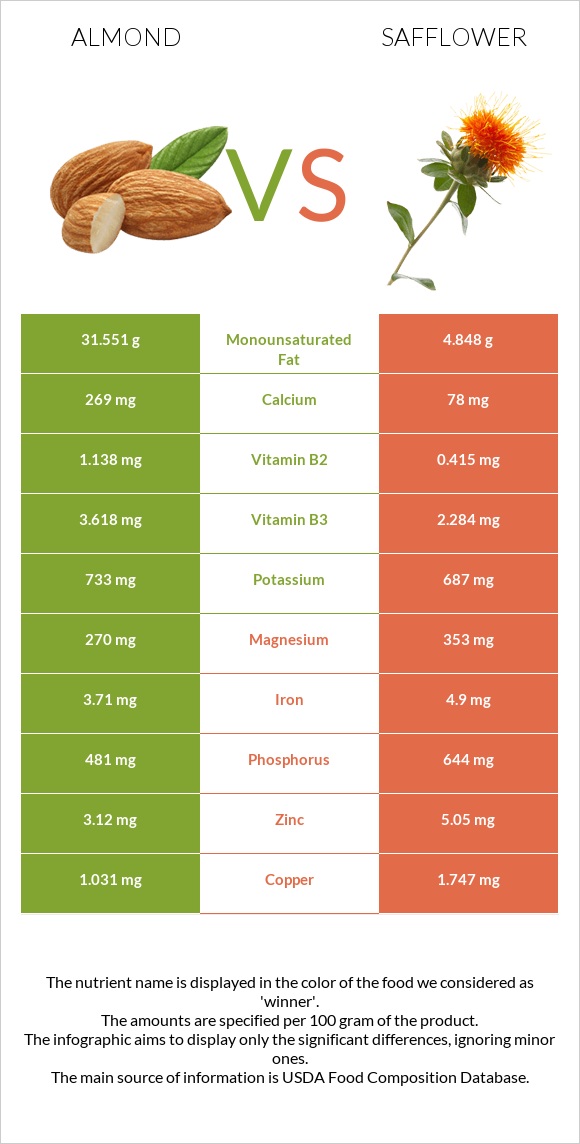
Important differences between almonds and safflower Almonds have more vitamin B2 and calcium; however, safflower is richer in vitamin B1, copper, vitamin B6, vitamin B5, folate, phosphorus, magnesium, and zinc. Safflower's daily need coverage for vitamin B1 is 80% more. Almonds contain 3 times more calcium than safflower. Almonds contain 269mg of calcium, while safflower contains 78mg. The food varieties used in the comparison are Nuts, almonds and Seeds, safflower seed kernels, dried .
Infographic
Mineral Comparison
Mineral comparison score is based on the number of minerals by which one or the other food is richer. The "coverage" charts below show how much of the daily needs can be covered by 300 grams of the food.
3
100 g
300 g
1 almond - 1.2g 1 oz (23 whole kernels) - 28.35g 1 cup, sliced - 92g 1 cup, ground - 95g 1 cup, slivered - 108g 1 cup, whole - 143g
Magnesium
Magnesium
Calcium
Calcium
Potassium
Potassium
Iron
Iron
Copper
Copper
Zinc
Zinc
Phosphorus
Phosphorus
Sodium
Sodium
Manganese
Manganese
Selenium
Selenium
193%
81%
65%
139%
344%
85%
206%
0.13%
284%
22%
5
100 g
300 g
1 oz - 28.35g
Magnesium
Magnesium
Calcium
Calcium
Potassium
Potassium
Iron
Iron
Copper
Copper
Zinc
Zinc
Phosphorus
Phosphorus
Sodium
Sodium
Manganese
Manganese
Selenium
Selenium
252%
23%
61%
184%
582%
138%
276%
0.39%
263%
0%
Vitamin Comparison
Vitamin comparison score is based on the number of vitamins by which one or the other food is richer. The "coverage" charts below show how much of the daily needs can be covered by 300 grams of the food.
3
100 g
300 g
1 almond - 1.2g 1 oz (23 whole kernels) - 28.35g 1 cup, sliced - 92g 1 cup, ground - 95g 1 cup, slivered - 108g 1 cup, whole - 143g
Vitamin C
Vit. C
Vitamin D
Vit. D
Vitamin A
Vit. A
Vitamin E
Vit. E
Vitamin B1
Vit. B1
Vitamin B2
Vit. B2
Vitamin B3
Vit. B3
Vitamin B5
Vit. B5
Vitamin B6
Vit. B6
Vitamin B12
Vit. B12
Vitamin K
Vit. K
Folate
Folate
0%
0%
0%
513%
51%
263%
68%
28%
32%
0%
0%
33%
5
100 g
300 g
1 oz - 28.35g
Vitamin C
Vit. C
Vitamin D
Vit. D
Vitamin A
Vit. A
Vitamin E
Vit. E
Vitamin B1
Vit. B1
Vitamin B2
Vit. B2
Vitamin B3
Vit. B3
Vitamin B5
Vit. B5
Vitamin B6
Vit. B6
Vitamin B12
Vit. B12
Vitamin K
Vit. K
Folate
Folate
0%
0%
1%
0%
291%
96%
43%
242%
270%
0%
0%
120%
All nutrients comparison - raw data values
Nutrient
DV% diff.
Vitamin E
25.63mg
171%
Polyunsaturated fat
12.329g
28.223g
106%
Copper
1.031mg
1.747mg
80%
Vitamin B1
0.205mg
1.163mg
80%
Vitamin B6
0.137mg
1.17mg
79%
Vitamin B5
0.471mg
4.03mg
71%
Monounsaturated fat
31.551g
4.848g
67%
Vitamin B2
1.138mg
0.415mg
56%
Fiber
12.5g
50%
Folate
44µg
160µg
29%
Phosphorus
481mg
644mg
23%
Magnesium
270mg
353mg
20%
Calcium
269mg
78mg
19%
Fats
49.93g
38.45g
18%
Zinc
3.12mg
5.05mg
18%
Iron
3.71mg
4.9mg
15%
Protein
21.15g
16.18g
10%
Choline
52.1mg
9%
Vitamin B3
3.618mg
2.284mg
8%
Manganese
2.179mg
2.014mg
7%
Selenium
4.1µg
7%
Carbs
21.55g
34.29g
4%
Calories
579kcal
517kcal
3%
Potassium
733mg
687mg
1%
Saturated fat
3.802g
3.682g
1%
Protein per 100 calories
3.7g
3.1g
N/A
Calories per 10 g protein
274kcal
320kcal
N/A
Weight per 100 calories
17g
19g
N/A
Unsaturated / Saturated Fat ratio
12
9
N/A
Net carbs
9.05g
34.29g
N/A
Sugar
4.35g
N/A
Starch
0.72g
0%
Sodium
1mg
3mg
0%
Vitamin A
0µg
3µg
0%
Trans fat
0.015g
N/A
Tryptophan
0.211mg
0.183mg
0%
Threonine
0.601mg
0.586mg
0%
Isoleucine
0.751mg
0.717mg
0%
Leucine
1.473mg
1.154mg
0%
Lysine
0.568mg
0.534mg
0%
Methionine
0.157mg
0.284mg
0%
Phenylalanine
1.132mg
0.806mg
0%
Valine
0.855mg
1.025mg
0%
Histidine
0.539mg
0.452mg
0%
Fructose
0.11g
0%
Omega-3 - ALA
0.003g
N/A
Omega-6 - Eicosadienoic acid
0.002g
N/A
Omega-6 - Linoleic acid
12.32g
N/A
Macronutrient Comparison
Macronutrient breakdown side-by-side comparison
2
21%
50%
22%
4%
3%
Protein:
21.15 g
Fats:
49.93 g
Carbs:
21.55 g
Water:
4.41 g
Other:
2.96 g
3
16%
38%
34%
6%
5%
Protein:
16.18 g
Fats:
38.45 g
Carbs:
34.29 g
Water:
5.62 g
Other:
5.46 g
Contains
more
Protein Protein
+30.7%
Contains
more
Fats Fats
+29.9%
Contains
more
Carbs Carbs
+59.1%
Contains
more
Water Water
+27.4%
Contains
more
Other Other
+84.5%
Fat Type Comparison
Fat type breakdown side-by-side comparison
1
8%
66%
26%
Saturated fat:
Sat. Fat
3.802 g
Monounsaturated fat:
Mono. Fat
31.551 g
Polyunsaturated fat:
Poly. Fat
12.329 g
2
10%
13%
77%
Saturated fat:
Sat. Fat
3.682 g
Monounsaturated fat:
Mono. Fat
4.848 g
Polyunsaturated fat:
Poly. Fat
28.223 g
Contains
more
Mono. Fat Monounsaturated fat
+550.8%
Contains
more
Poly. Fat Polyunsaturated fat
+128.9%
~equal in
Saturated fat
~3.682g