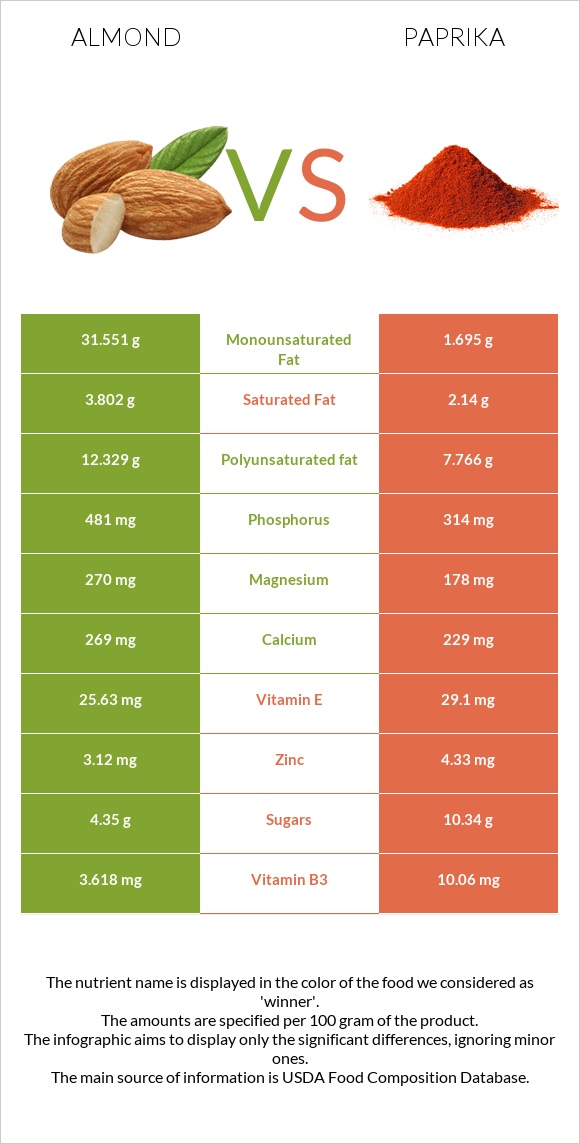
How are almonds and paprika different? Almonds are higher in copper and manganese; however, paprika is richer in vitamin A, iron, vitamin B6, fiber, vitamin K, potassium, vitamin B5, and vitamin B3. Daily need coverage for vitamin A for paprika is 985% higher. Nuts, almonds and Spices, paprika are the varieties used in this article.
Infographic
Mineral Comparison
Mineral comparison score is based on the number of minerals by which one or the other food is richer. The "coverage" charts below show how much of the daily needs can be covered by 300 grams of the food.
6
100 g
300 g
1 almond - 1.2g 1 oz (23 whole kernels) - 28.35g 1 cup, sliced - 92g 1 cup, ground - 95g 1 cup, slivered - 108g 1 cup, whole - 143g
Magnesium
Magnesium
Calcium
Calcium
Potassium
Potassium
Iron
Iron
Copper
Copper
Zinc
Zinc
Phosphorus
Phosphorus
Sodium
Sodium
Manganese
Manganese
Selenium
Selenium
193%
81%
65%
139%
344%
85%
206%
0.13%
284%
22%
4
100 g
300 g
0.25 tsp - 0.5g 1 tbsp - 6.8g
Magnesium
Magnesium
Calcium
Calcium
Potassium
Potassium
Iron
Iron
Copper
Copper
Zinc
Zinc
Phosphorus
Phosphorus
Sodium
Sodium
Manganese
Manganese
Selenium
Selenium
127%
69%
201%
793%
238%
118%
135%
8.9%
207%
34%
Vitamin Comparison
Vitamin comparison score is based on the number of vitamins by which one or the other food is richer. The "coverage" charts below show how much of the daily needs can be covered by 300 grams of the food.
0
100 g
300 g
1 almond - 1.2g 1 oz (23 whole kernels) - 28.35g 1 cup, sliced - 92g 1 cup, ground - 95g 1 cup, slivered - 108g 1 cup, whole - 143g
Vitamin C
Vit. C
Vitamin D
Vit. D
Vitamin A
Vit. A
Vitamin E
Vit. E
Vitamin B1
Vit. B1
Vitamin B2
Vit. B2
Vitamin B3
Vit. B3
Vitamin B5
Vit. B5
Vitamin B6
Vit. B6
Vitamin B12
Vit. B12
Vitamin K
Vit. K
Folate
Folate
0%
0%
0%
513%
51%
263%
68%
28%
32%
0%
0%
33%
9
100 g
300 g
0.25 tsp - 0.5g 1 tbsp - 6.8g
Vitamin C
Vit. C
Vitamin D
Vit. D
Vitamin A
Vit. A
Vitamin E
Vit. E
Vitamin B1
Vit. B1
Vitamin B2
Vit. B2
Vitamin B3
Vit. B3
Vitamin B5
Vit. B5
Vitamin B6
Vit. B6
Vitamin B12
Vit. B12
Vitamin K
Vit. K
Folate
Folate
3%
0%
821%
582%
83%
284%
189%
151%
494%
0%
201%
37%
All nutrients comparison - raw data values
Nutrient
DV% diff.
Vitamin A
0µg
2463µg
274%
Iron
3.71mg
21.14mg
218%
Vitamin B6
0.137mg
2.141mg
154%
Fiber
12.5g
34.9g
90%
Monounsaturated fat
31.551g
1.695g
75%
Vitamin K
0µg
80.3µg
67%
Fats
49.93g
12.89g
57%
Potassium
733mg
2280mg
46%
Vitamin B5
0.471mg
2.51mg
41%
Vitamin B3
3.618mg
10.06mg
40%
Copper
1.031mg
0.713mg
35%
Polyunsaturated fat
12.329g
7.766g
30%
Manganese
2.179mg
1.59mg
26%
Phosphorus
481mg
314mg
24%
Vitamin E
25.63mg
29.1mg
23%
Magnesium
270mg
178mg
22%
Calories
579kcal
282kcal
15%
Protein
21.15g
14.14g
14%
Carbs
21.55g
53.99g
11%
Zinc
3.12mg
4.33mg
11%
Vitamin B1
0.205mg
0.33mg
10%
Saturated fat
3.802g
2.14g
8%
Fructose
0.11g
6.71g
8%
Vitamin B2
1.138mg
1.23mg
7%
Calcium
269mg
229mg
4%
Selenium
4.1µg
6.3µg
4%
Sodium
1mg
68mg
3%
Vitamin C
0mg
0.9mg
1%
Folate
44µg
49µg
1%
Protein per 100 calories
3.7g
5g
N/A
Calories per 10 g protein
274kcal
199kcal
N/A
Weight per 100 calories
17g
35g
N/A
Unsaturated / Saturated Fat ratio
12
4.4
N/A
Net carbs
9.05g
19.09g
N/A
Sugar
4.35g
10.34g
N/A
Starch
0.72g
0%
Trans fat
0.015g
0g
N/A
Choline
52.1mg
51.5mg
0%
Tryptophan
0.211mg
0.07mg
0%
Threonine
0.601mg
0.49mg
0%
Isoleucine
0.751mg
0.57mg
0%
Leucine
1.473mg
0.92mg
0%
Lysine
0.568mg
0.69mg
0%
Methionine
0.157mg
0.2mg
0%
Phenylalanine
1.132mg
0.61mg
0%
Valine
0.855mg
0.75mg
0%
Histidine
0.539mg
0.25mg
0%
Omega-3 - ALA
0.003g
0.453g
N/A
Omega-6 - Eicosadienoic acid
0.002g
0g
N/A
Omega-6 - Linoleic acid
12.32g
N/A
Macronutrient Comparison
Macronutrient breakdown side-by-side comparison
2
21%
50%
22%
4%
3%
Protein:
21.15 g
Fats:
49.93 g
Carbs:
21.55 g
Water:
4.41 g
Other:
2.96 g
3
14%
13%
54%
11%
8%
Protein:
14.14 g
Fats:
12.89 g
Carbs:
53.99 g
Water:
11.24 g
Other:
7.74 g
Contains
more
Protein Protein
+49.6%
Contains
more
Fats Fats
+287.4%
Contains
more
Carbs Carbs
+150.5%
Contains
more
Water Water
+154.9%
Contains
more
Other Other
+161.5%
Fat Type Comparison
Fat type breakdown side-by-side comparison
2
8%
66%
26%
Saturated fat:
Sat. Fat
3.802 g
Monounsaturated fat:
Mono. Fat
31.551 g
Polyunsaturated fat:
Poly. Fat
12.329 g
1
18%
15%
67%
Saturated fat:
Sat. Fat
2.14 g
Monounsaturated fat:
Mono. Fat
1.695 g
Polyunsaturated fat:
Poly. Fat
7.766 g
Contains
more
Mono. Fat Monounsaturated fat
+1761.4%
Contains
more
Poly. Fat Polyunsaturated fat
+58.8%
Contains
less
Sat. Fat Saturated fat
-43.7%
Carbohydrate type comparison
Carbohydrate type breakdown side-by-side comparison
3
14%
78%
3%
2%
Starch:
0.72 g
Sucrose:
3.95 g
Glucose:
0.17 g
Fructose:
0.11 g
Lactose:
0 g
Maltose:
0.04 g
Galactose:
0.07 g
3
8%
25%
65%
2%
Starch:
0 g
Sucrose:
0.81 g
Glucose:
2.63 g
Fructose:
6.71 g
Lactose:
0 g
Maltose:
0 g
Galactose:
0.19 g
Contains
more
Starch Starch
+∞%
Contains
more
Sucrose Sucrose
+387.7%
Contains
more
Maltose Maltose
+∞%
Contains
more
Glucose Glucose
+1447.1%
Contains
more
Fructose Fructose
+6000%
Contains
more
Galactose Galactose
+171.4%