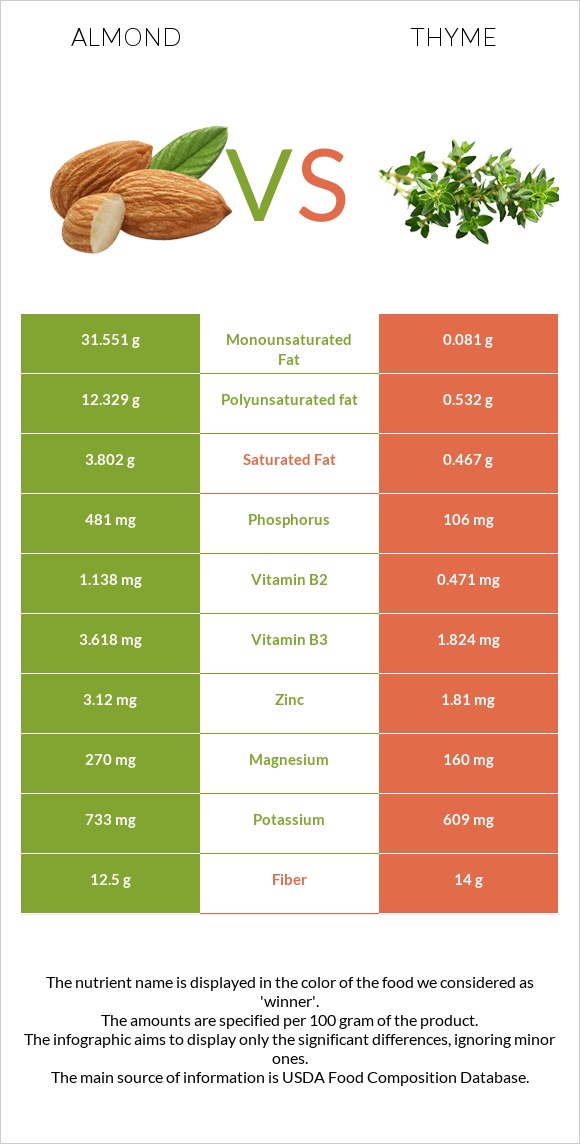
Significant differences between almonds and thyme Almonds have more phosphorus, copper, vitamin B2, magnesium, and manganese; however, thyme is richer in vitamin C, iron, vitamin A, and vitamin B6. Thyme covers your daily vitamin C needs 178% more than almonds. Thyme has 8 times less saturated fat than almonds. Almonds have 3.802g of saturated fat, while thyme has 0.467g. Thyme has a higher glycemic index. The glycemic index of thyme is 45, while the glycemic index of almonds is 0. Specific food types used in this comparison are Nuts, almonds and Thyme, fresh .
Infographic
Mineral Comparison
Mineral comparison score is based on the number of minerals by which one or the other food is richer. The "coverage" charts below show how much of the daily needs can be covered by 300 grams of the food.
8
100 g
300 g
1 almond - 1.2g 1 oz (23 whole kernels) - 28.35g 1 cup, sliced - 92g 1 cup, ground - 95g 1 cup, slivered - 108g 1 cup, whole - 143g
Magnesium
Magnesium
Calcium
Calcium
Potassium
Potassium
Iron
Iron
Copper
Copper
Zinc
Zinc
Phosphorus
Phosphorus
Sodium
Sodium
Manganese
Manganese
Selenium
Selenium
193%
81%
65%
139%
344%
85%
206%
0.13%
284%
22%
2
100 g
300 g
0.5 tsp - 0.4g 1 tsp - 0.8g
Magnesium
Magnesium
Calcium
Calcium
Potassium
Potassium
Iron
Iron
Copper
Copper
Zinc
Zinc
Phosphorus
Phosphorus
Sodium
Sodium
Manganese
Manganese
Selenium
Selenium
114%
122%
54%
654%
185%
49%
45%
1.2%
224%
0%
Vitamin Comparison
Vitamin comparison score is based on the number of vitamins by which one or the other food is richer. The "coverage" charts below show how much of the daily needs can be covered by 300 grams of the food.
5
100 g
300 g
1 almond - 1.2g 1 oz (23 whole kernels) - 28.35g 1 cup, sliced - 92g 1 cup, ground - 95g 1 cup, slivered - 108g 1 cup, whole - 143g
Vitamin C
Vit. C
Vitamin D
Vit. D
Vitamin A
Vit. A
Vitamin E
Vit. E
Vitamin B1
Vit. B1
Vitamin B2
Vit. B2
Vitamin B3
Vit. B3
Vitamin B5
Vit. B5
Vitamin B6
Vit. B6
Vitamin B12
Vit. B12
Vitamin K
Vit. K
Folate
Folate
0%
0%
0%
513%
51%
263%
68%
28%
32%
0%
0%
33%
3
100 g
300 g
0.5 tsp - 0.4g 1 tsp - 0.8g
Vitamin C
Vit. C
Vitamin D
Vit. D
Vitamin A
Vit. A
Vitamin E
Vit. E
Vitamin B1
Vit. B1
Vitamin B2
Vit. B2
Vitamin B3
Vit. B3
Vitamin B5
Vit. B5
Vitamin B6
Vit. B6
Vitamin B12
Vit. B12
Vitamin K
Vit. K
Folate
Folate
534%
0%
79%
0%
12%
109%
34%
25%
80%
0%
0%
34%
All nutrients comparison - raw data values
Nutrient
DV% diff.
Vitamin C
0mg
160.1mg
178%
Iron
3.71mg
17.45mg
172%
Vitamin E
25.63mg
171%
Monounsaturated fat
31.551g
0.081g
79%
Polyunsaturated fat
12.329g
0.532g
79%
Fats
49.93g
1.68g
74%
Phosphorus
481mg
106mg
54%
Copper
1.031mg
0.555mg
53%
Vitamin B2
1.138mg
0.471mg
51%
Protein
21.15g
5.56g
31%
Magnesium
270mg
160mg
26%
Vitamin A
0µg
238µg
26%
Calories
579kcal
101kcal
24%
Manganese
2.179mg
1.719mg
20%
Vitamin B6
0.137mg
0.348mg
16%
Saturated fat
3.802g
0.467g
15%
Calcium
269mg
405mg
14%
Vitamin B1
0.205mg
0.048mg
13%
Zinc
3.12mg
1.81mg
12%
Vitamin B3
3.618mg
1.824mg
11%
Choline
52.1mg
9%
Selenium
4.1µg
7%
Fiber
12.5g
14g
6%
Potassium
733mg
609mg
4%
Carbs
21.55g
24.45g
1%
Vitamin B5
0.471mg
0.409mg
1%
Protein per 100 calories
3.7g
5.5g
N/A
Calories per 10 g protein
274kcal
182kcal
N/A
Weight per 100 calories
17g
99g
N/A
Unsaturated / Saturated Fat ratio
12
1.3
N/A
Net carbs
9.05g
10.45g
N/A
Sugar
4.35g
N/A
Starch
0.72g
0%
Sodium
1mg
9mg
0%
Folate
44µg
45µg
0%
Trans fat
0.015g
0g
N/A
Tryptophan
0.211mg
0.114mg
0%
Threonine
0.601mg
0.154mg
0%
Isoleucine
0.751mg
0.285mg
0%
Leucine
1.473mg
0.262mg
0%
Lysine
0.568mg
0.126mg
0%
Methionine
0.157mg
0%
Phenylalanine
1.132mg
0%
Valine
0.855mg
0.307mg
0%
Histidine
0.539mg
0%
Fructose
0.11g
0%
Omega-3 - ALA
0.003g
N/A
Omega-6 - Eicosadienoic acid
0.002g
N/A
Omega-6 - Linoleic acid
12.32g
N/A
Macronutrient Comparison
Macronutrient breakdown side-by-side comparison
2
21%
50%
22%
4%
3%
Protein:
21.15 g
Fats:
49.93 g
Carbs:
21.55 g
Water:
4.41 g
Other:
2.96 g
3
6%
2%
24%
65%
3%
Protein:
5.56 g
Fats:
1.68 g
Carbs:
24.45 g
Water:
65.11 g
Other:
3.2 g
Contains
more
Protein Protein
+280.4%
Contains
more
Fats Fats
+2872%
Contains
more
Carbs Carbs
+13.5%
Contains
more
Water Water
+1376.4%
Fat Type Comparison
Fat type breakdown side-by-side comparison
2
8%
66%
26%
Saturated fat:
Sat. Fat
3.802 g
Monounsaturated fat:
Mono. Fat
31.551 g
Polyunsaturated fat:
Poly. Fat
12.329 g
1
43%
8%
49%
Saturated fat:
Sat. Fat
0.467 g
Monounsaturated fat:
Mono. Fat
0.081 g
Polyunsaturated fat:
Poly. Fat
0.532 g
Contains
more
Mono. Fat Monounsaturated fat
+38851.9%
Contains
more
Poly. Fat Polyunsaturated fat
+2217.5%
Contains
less
Sat. Fat Saturated fat
-87.7%