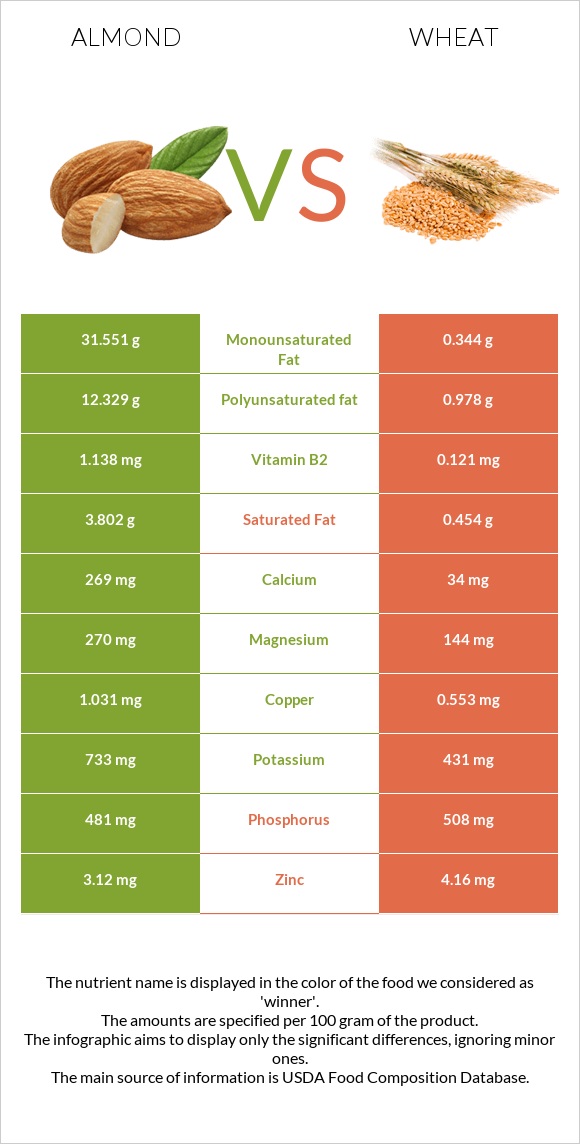
What are the differences between almonds and wheat ? Almonds are higher in vitamin B2, copper, magnesium, and calcium, yet wheat is higher in selenium, manganese, vitamin B6, vitamin B3, and vitamin B1. Wheat 's daily need coverage for selenium is 155% more. Almonds have 9 times more vitamin B2 than wheat . While almonds have 1.138mg of vitamin B2, wheat has only 0.121mg. The amount of saturated fat in wheat is lower. The glycemic index of almonds is lower. We used Nuts, almonds and Wheat, durum types in this article.
Infographic
Mineral Comparison
Mineral comparison score is based on the number of minerals by which one or the other food is richer. The "coverage" charts below show how much of the daily needs can be covered by 300 grams of the food.
5
100 g
300 g
1 almond - 1.2g 1 oz (23 whole kernels) - 28.35g 1 cup, sliced - 92g 1 cup, ground - 95g 1 cup, slivered - 108g 1 cup, whole - 143g
Magnesium
Magnesium
Calcium
Calcium
Potassium
Potassium
Iron
Iron
Copper
Copper
Zinc
Zinc
Phosphorus
Phosphorus
Sodium
Sodium
Manganese
Manganese
Selenium
Selenium
193%
81%
65%
139%
344%
85%
206%
0.13%
284%
22%
3
100 g
300 g
1 cup - 192g
Magnesium
Magnesium
Calcium
Calcium
Potassium
Potassium
Iron
Iron
Copper
Copper
Zinc
Zinc
Phosphorus
Phosphorus
Sodium
Sodium
Manganese
Manganese
Selenium
Selenium
103%
10%
38%
132%
184%
113%
218%
0.26%
393%
488%
Vitamin Comparison
Vitamin comparison score is based on the number of vitamins by which one or the other food is richer. The "coverage" charts below show how much of the daily needs can be covered by 300 grams of the food.
2
100 g
300 g
1 almond - 1.2g 1 oz (23 whole kernels) - 28.35g 1 cup, sliced - 92g 1 cup, ground - 95g 1 cup, slivered - 108g 1 cup, whole - 143g
Vitamin C
Vit. C
Vitamin D
Vit. D
Vitamin A
Vit. A
Vitamin E
Vit. E
Vitamin B1
Vit. B1
Vitamin B2
Vit. B2
Vitamin B3
Vit. B3
Vitamin B5
Vit. B5
Vitamin B6
Vit. B6
Vitamin B12
Vit. B12
Vitamin K
Vit. K
Folate
Folate
0%
0%
0%
513%
51%
263%
68%
28%
32%
0%
0%
33%
4
100 g
300 g
1 cup - 192g
Vitamin C
Vit. C
Vitamin D
Vit. D
Vitamin A
Vit. A
Vitamin E
Vit. E
Vitamin B1
Vit. B1
Vitamin B2
Vit. B2
Vitamin B3
Vit. B3
Vitamin B5
Vit. B5
Vitamin B6
Vit. B6
Vitamin B12
Vit. B12
Vitamin K
Vit. K
Folate
Folate
0%
0%
0%
0%
105%
28%
126%
56%
97%
0%
0%
32%
All nutrients comparison - raw data values
Nutrient
DV% diff.
Vitamin E
25.63mg
171%
Selenium
4.1µg
89.4µg
155%
Vitamin B2
1.138mg
0.121mg
78%
Monounsaturated fat
31.551g
0.344g
78%
Polyunsaturated fat
12.329g
0.978g
76%
Fats
49.93g
2.47g
73%
Copper
1.031mg
0.553mg
53%
Fiber
12.5g
50%
Manganese
2.179mg
3.012mg
36%
Magnesium
270mg
144mg
30%
Calcium
269mg
34mg
24%
Vitamin B6
0.137mg
0.419mg
22%
Vitamin B3
3.618mg
6.738mg
20%
Vitamin B1
0.205mg
0.419mg
18%
Carbs
21.55g
71.13g
17%
Protein
21.15g
13.68g
15%
Saturated fat
3.802g
0.454g
15%
Calories
579kcal
339kcal
12%
Potassium
733mg
431mg
9%
Zinc
3.12mg
4.16mg
9%
Vitamin B5
0.471mg
0.935mg
9%
Choline
52.1mg
9%
Phosphorus
481mg
508mg
4%
Iron
3.71mg
3.52mg
2%
Protein per 100 calories
3.7g
4g
N/A
Calories per 10 g protein
274kcal
248kcal
N/A
Weight per 100 calories
17g
29g
N/A
Unsaturated / Saturated Fat ratio
12
2.9
N/A
Net carbs
9.05g
71.13g
N/A
Sugar
4.35g
N/A
Starch
0.72g
0%
Sodium
1mg
2mg
0%
Folate
44µg
43µg
0%
Trans fat
0.015g
N/A
Tryptophan
0.211mg
0.176mg
0%
Threonine
0.601mg
0.366mg
0%
Isoleucine
0.751mg
0.533mg
0%
Leucine
1.473mg
0.934mg
0%
Lysine
0.568mg
0.303mg
0%
Methionine
0.157mg
0.221mg
0%
Phenylalanine
1.132mg
0.681mg
0%
Valine
0.855mg
0.594mg
0%
Histidine
0.539mg
0.322mg
0%
Fructose
0.11g
0%
Omega-3 - ALA
0.003g
N/A
Omega-6 - Eicosadienoic acid
0.002g
N/A
Omega-6 - Linoleic acid
12.32g
N/A
Macronutrient Comparison
Macronutrient breakdown side-by-side comparison
3
21%
50%
22%
4%
3%
Protein:
21.15 g
Fats:
49.93 g
Carbs:
21.55 g
Water:
4.41 g
Other:
2.96 g
2
14%
2%
71%
11%
2%
Protein:
13.68 g
Fats:
2.47 g
Carbs:
71.13 g
Water:
10.94 g
Other:
1.78 g
Contains
more
Protein Protein
+54.6%
Contains
more
Fats Fats
+1921.5%
Contains
more
Other Other
+66.3%
Contains
more
Carbs Carbs
+230.1%
Contains
more
Water Water
+148.1%
Fat Type Comparison
Fat type breakdown side-by-side comparison
2
8%
66%
26%
Saturated fat:
Sat. Fat
3.802 g
Monounsaturated fat:
Mono. Fat
31.551 g
Polyunsaturated fat:
Poly. Fat
12.329 g
1
26%
19%
55%
Saturated fat:
Sat. Fat
0.454 g
Monounsaturated fat:
Mono. Fat
0.344 g
Polyunsaturated fat:
Poly. Fat
0.978 g
Contains
more
Mono. Fat Monounsaturated fat
+9071.8%
Contains
more
Poly. Fat Polyunsaturated fat
+1160.6%
Contains
less
Sat. Fat Saturated fat
-88.1%