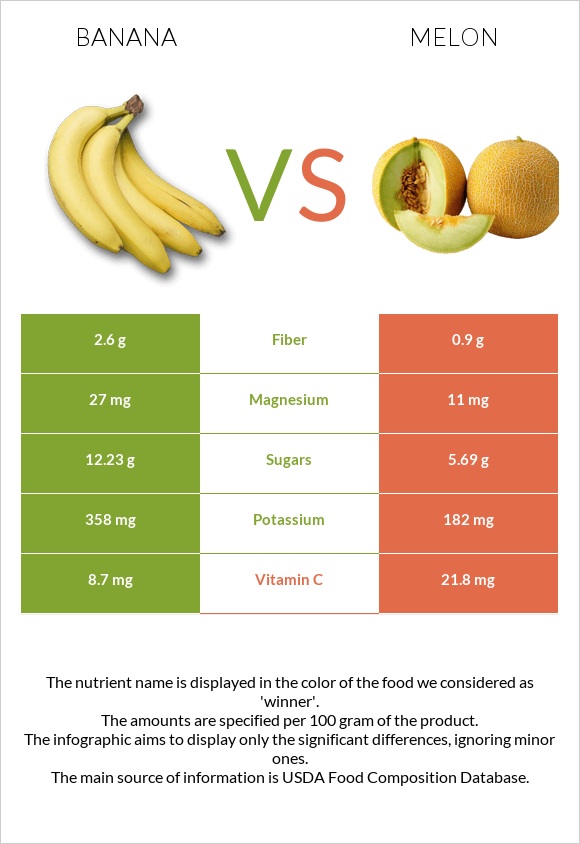
Summary of differences between bananas and melon Bananas have more vitamin B6, manganese, fiber, and potassium, while melon has more vitamin C. Bananas cover your daily need for vitamin B6, 16% more than melon. Bananas contain 8 times more manganese than melon. While bananas contain 0.27mg of manganese, melon contains only 0.035mg. The amount of sugar in melon is lower. Bananas have a lower glycemic index. The glycemic index of bananas is 48, while the glycemic index of melon is 62. These are the specific foods used in this comparison Bananas, raw and Melons, casaba, raw .
Infographic
Mineral Comparison
Mineral comparison score is based on the number of minerals by which one or the other food is richer. The "coverage" charts below show how much of the daily needs can be covered by 300 grams of the food.
8
100 g
300 g
1 extra small (less than 6" long) - 81g 1 small (6" to 6-7/8" long) - 101g 1 medium (7" to 7-7/8" long) - 118g 1 NLEA serving - 126g 1 large (8" to 8-7/8" long) - 136g 1 cup, sliced - 150g 1 extra large (9" or longer) - 152g 1 cup, mashed - 225g
Magnesium
Magnesium
Calcium
Calcium
Potassium
Potassium
Iron
Iron
Copper
Copper
Zinc
Zinc
Phosphorus
Phosphorus
Sodium
Sodium
Manganese
Manganese
Selenium
Selenium
19%
1.5%
32%
9.8%
26%
4.1%
9.4%
0.13%
35%
5.5%
2
100 g
300 g
0.1 fruit - 164g 1 cup, cubes - 170g 1 melon - 1640g
Magnesium
Magnesium
Calcium
Calcium
Potassium
Potassium
Iron
Iron
Copper
Copper
Zinc
Zinc
Phosphorus
Phosphorus
Sodium
Sodium
Manganese
Manganese
Selenium
Selenium
7.9%
3.3%
16%
13%
20%
1.9%
2.1%
1.2%
4.6%
2.2%
Vitamin Comparison
Vitamin comparison score is based on the number of vitamins by which one or the other food is richer. The "coverage" charts below show how much of the daily needs can be covered by 300 grams of the food.
8
100 g
300 g
1 extra small (less than 6" long) - 81g 1 small (6" to 6-7/8" long) - 101g 1 medium (7" to 7-7/8" long) - 118g 1 NLEA serving - 126g 1 large (8" to 8-7/8" long) - 136g 1 cup, sliced - 150g 1 extra large (9" or longer) - 152g 1 cup, mashed - 225g
Vitamin C
Vit. C
Vitamin D
Vit. D
Vitamin A
Vit. A
Vitamin E
Vit. E
Vitamin B1
Vit. B1
Vitamin B2
Vit. B2
Vitamin B3
Vit. B3
Vitamin B5
Vit. B5
Vitamin B6
Vit. B6
Vitamin B12
Vit. B12
Vitamin K
Vit. K
Folate
Folate
29%
0%
1%
2%
7.8%
17%
12%
20%
85%
0%
1.3%
15%
2
100 g
300 g
0.1 fruit - 164g 1 cup, cubes - 170g 1 melon - 1640g
Vitamin C
Vit. C
Vitamin D
Vit. D
Vitamin A
Vit. A
Vitamin E
Vit. E
Vitamin B1
Vit. B1
Vitamin B2
Vit. B2
Vitamin B3
Vit. B3
Vitamin B5
Vit. B5
Vitamin B6
Vit. B6
Vitamin B12
Vit. B12
Vitamin K
Vit. K
Folate
Folate
73%
0%
0%
1%
3.8%
7.2%
4.4%
5%
38%
0%
6.3%
6%
All nutrients comparison - raw data values
Nutrient
DV% diff.
Vitamin B6
0.367mg
0.163mg
16%
Vitamin C
8.7mg
21.8mg
15%
Manganese
0.27mg
0.035mg
10%
Fiber
2.6g
0.9g
7%
Fructose
4.85g
6%
Carbs
22.84g
6.58g
5%
Potassium
358mg
182mg
5%
Vitamin B5
0.334mg
0.084mg
5%
Magnesium
27mg
11mg
4%
Calories
89kcal
28kcal
3%
Vitamin B2
0.073mg
0.031mg
3%
Vitamin B3
0.665mg
0.232mg
3%
Folate
20µg
8µg
3%
Copper
0.078mg
0.06mg
2%
Starch
5.38g
2%
Phosphorus
22mg
5mg
2%
Vitamin K
0.5µg
2.5µg
2%
Calcium
5mg
11mg
1%
Iron
0.26mg
0.34mg
1%
Zinc
0.15mg
0.07mg
1%
Selenium
1µg
0.4µg
1%
Vitamin B1
0.031mg
0.015mg
1%
Protein
1.09g
1.11g
0%
Protein per 100 calories
1.2g
4g
N/A
Calories per 10 g protein
817kcal
252kcal
N/A
Weight per 100 calories
112g
357g
N/A
Fats
0.33g
0.1g
0%
Net carbs
20.24g
5.68g
N/A
Sugar
12.23g
5.69g
N/A
Sodium
1mg
9mg
0%
Vitamin A
3µg
0µg
0%
Vitamin E
0.1mg
0.05mg
0%
Choline
9.8mg
7.6mg
0%
Saturated fat
0.112g
0.025g
0%
Monounsaturated fat
0.032g
0.002g
0%
Polyunsaturated fat
0.073g
0.039g
0%
Tryptophan
0.009mg
0%
Threonine
0.028mg
0%
Isoleucine
0.028mg
0%
Leucine
0.068mg
0%
Lysine
0.05mg
0%
Methionine
0.008mg
0%
Phenylalanine
0.049mg
0%
Valine
0.047mg
0%
Histidine
0.077mg
0%
Macronutrient Comparison
Macronutrient breakdown side-by-side comparison
3
23%
75%
Protein:
1.09 g
Fats:
0.33 g
Carbs:
22.84 g
Water:
74.91 g
Other:
0.83 g
2
7%
92%
Protein:
1.11 g
Fats:
0.1 g
Carbs:
6.58 g
Water:
91.85 g
Other:
0.36 g
Contains
more
Fats Fats
+230%
Contains
more
Carbs Carbs
+247.1%
Contains
more
Other Other
+130.6%
Contains
more
Water Water
+22.6%
Fat Type Comparison
Fat type breakdown side-by-side comparison
2
52%
15%
34%
Saturated fat:
Sat. Fat
0.112 g
Monounsaturated fat:
Mono. Fat
0.032 g
Polyunsaturated fat:
Poly. Fat
0.073 g
1
38%
3%
59%
Saturated fat:
Sat. Fat
0.025 g
Monounsaturated fat:
Mono. Fat
0.002 g
Polyunsaturated fat:
Poly. Fat
0.039 g
Contains
more
Mono. Fat Monounsaturated fat
+1500%
Contains
more
Poly. Fat Polyunsaturated fat
+87.2%
Contains
less
Sat. Fat Saturated fat
-77.7%