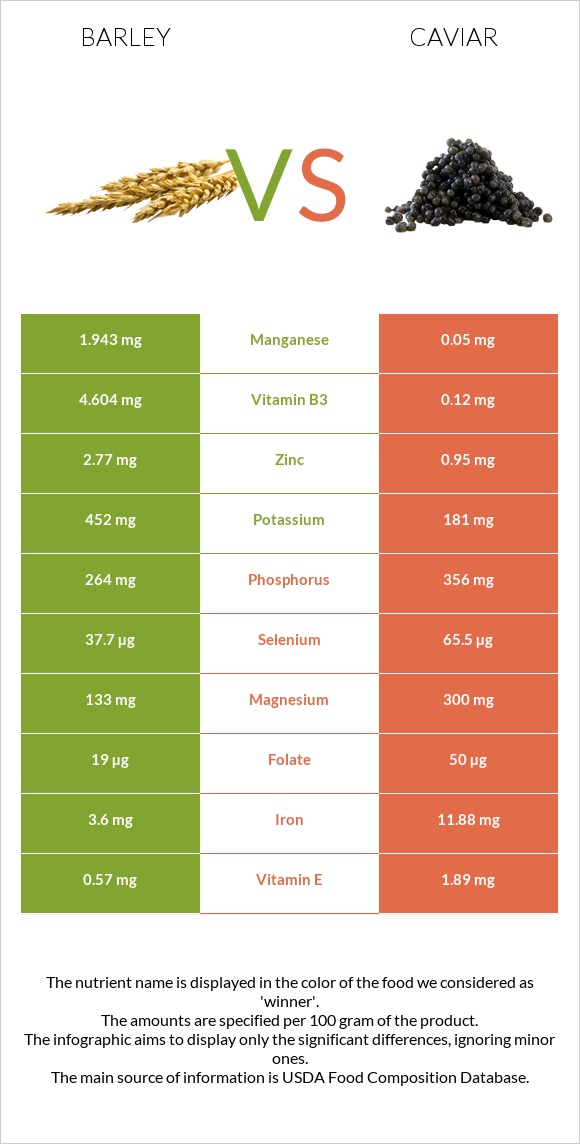
What are the main differences between barley and caviar? Barley is richer in manganese, fiber, and copper, yet caviar is richer in vitamin B12, iron, vitamin B5, selenium, and magnesium. Caviar's daily need coverage for vitamin B12 is 833% higher. Barley contains less sodium. Caviar has a lower glycemic index than barley. We used Barley, hulled and Fish, caviar, black, and red, granular types in this comparison.
Infographic
Mineral Comparison
Mineral comparison score is based on the number of minerals by which one or the other food is richer. The "coverage" charts below show how much of the daily needs can be covered by 300 grams of the food.
5
100 g
300 g
1 cup - 184g
Magnesium
Magnesium
Calcium
Calcium
Potassium
Potassium
Iron
Iron
Copper
Copper
Zinc
Zinc
Phosphorus
Phosphorus
Sodium
Sodium
Manganese
Manganese
Selenium
Selenium
95%
9.9%
40%
135%
166%
76%
113%
1.6%
253%
206%
5
100 g
300 g
1 tbsp - 16g 1 oz - 28.35g
Magnesium
Magnesium
Calcium
Calcium
Potassium
Potassium
Iron
Iron
Copper
Copper
Zinc
Zinc
Phosphorus
Phosphorus
Sodium
Sodium
Manganese
Manganese
Selenium
Selenium
214%
83%
16%
446%
37%
26%
153%
196%
6.5%
357%
Vitamin Comparison
Vitamin comparison score is based on the number of vitamins by which one or the other food is richer. The "coverage" charts below show how much of the daily needs can be covered by 300 grams of the food.
3
100 g
300 g
1 cup - 184g
Vitamin C
Vit. C
Vitamin D
Vit. D
Vitamin A
Vit. A
Vitamin E
Vit. E
Vitamin B1
Vit. B1
Vitamin B2
Vit. B2
Vitamin B3
Vit. B3
Vitamin B5
Vit. B5
Vitamin B6
Vit. B6
Vitamin B12
Vit. B12
Vitamin K
Vit. K
Folate
Folate
0%
0%
0.33%
11%
162%
66%
86%
17%
73%
0%
5.5%
14%
7
100 g
300 g
1 tbsp - 16g 1 oz - 28.35g
Vitamin C
Vit. C
Vitamin D
Vit. D
Vitamin A
Vit. A
Vitamin E
Vit. E
Vitamin B1
Vit. B1
Vitamin B2
Vit. B2
Vitamin B3
Vit. B3
Vitamin B5
Vit. B5
Vitamin B6
Vit. B6
Vitamin B12
Vit. B12
Vitamin K
Vit. K
Folate
Folate
0%
44%
90%
38%
48%
143%
2.3%
210%
74%
2500%
1.5%
38%
All nutrients comparison - raw data values
Nutrient
DV% diff.
Vitamin B12
0µg
20µg
833%
Cholesterol
0mg
588mg
196%
Iron
3.6mg
11.88mg
104%
Choline
490.9mg
89%
Manganese
1.943mg
0.05mg
82%
Fiber
17.3g
0g
69%
Sodium
12mg
1500mg
65%
Vitamin B5
0.282mg
3.5mg
64%
Selenium
37.7µg
65.5µg
51%
Copper
0.498mg
0.11mg
43%
Polyunsaturated fat
1.108g
7.405g
42%
Magnesium
133mg
300mg
40%
Vitamin B1
0.646mg
0.19mg
38%
Vitamin A
1µg
271µg
30%
Vitamin B3
4.604mg
0.12mg
28%
Vitamin B2
0.285mg
0.62mg
26%
Protein
12.48g
24.6g
24%
Fats
2.3g
17.9g
24%
Calcium
33mg
275mg
24%
Carbs
73.48g
4g
23%
Zinc
2.77mg
0.95mg
17%
Saturated fat
0.482g
4.06g
16%
Vitamin D*
0 IU
117 IU
15%
Vitamin D
0µg
2.9µg
15%
Phosphorus
264mg
356mg
13%
Monounsaturated fat
0.295g
4.631g
11%
Vitamin E
0.57mg
1.89mg
9%
Potassium
452mg
181mg
8%
Folate
19µg
50µg
8%
Calories
354kcal
264kcal
5%
Vitamin K
2.2µg
0.6µg
1%
Protein per 100 calories
3.5g
9.3g
N/A
Calories per 10 g protein
284kcal
107kcal
N/A
Weight per 100 calories
28g
38g
N/A
Unsaturated / Saturated Fat ratio
2.9
3
N/A
Net carbs
56.18g
4g
N/A
Sugar
0.8g
0g
N/A
Vitamin B6
0.318mg
0.32mg
0%
Tryptophan
0.208mg
0.323mg
0%
Threonine
0.424mg
1.263mg
0%
Isoleucine
0.456mg
1.035mg
0%
Leucine
0.848mg
2.133mg
0%
Lysine
0.465mg
1.834mg
0%
Methionine
0.24mg
0.646mg
0%
Phenylalanine
0.7mg
1.071mg
0%
Valine
0.612mg
1.263mg
0%
Histidine
0.281mg
0.649mg
0%
Omega-3 - EPA
0g
2.741g
N/A
Omega-3 - DHA
0g
3.8g
N/A
Omega-3 - DPA
0g
0.229g
N/A
Macronutrient Comparison
Macronutrient breakdown side-by-side comparison
1
12%
2%
73%
9%
2%
Protein:
12.48 g
Fats:
2.3 g
Carbs:
73.48 g
Water:
9.44 g
Other:
2.3 g
4
25%
18%
4%
48%
6%
Protein:
24.6 g
Fats:
17.9 g
Carbs:
4 g
Water:
47.5 g
Other:
6 g
Contains
more
Carbs Carbs
+1737%
Contains
more
Protein Protein
+97.1%
Contains
more
Fats Fats
+678.3%
Contains
more
Water Water
+403.2%
Contains
more
Other Other
+160.9%
Fat Type Comparison
Fat type breakdown side-by-side comparison
1
26%
16%
59%
Saturated fat:
Sat. Fat
0.482 g
Monounsaturated fat:
Mono. Fat
0.295 g
Polyunsaturated fat:
Poly. Fat
1.108 g
2
25%
29%
46%
Saturated fat:
Sat. Fat
4.06 g
Monounsaturated fat:
Mono. Fat
4.631 g
Polyunsaturated fat:
Poly. Fat
7.405 g
Contains
less
Sat. Fat Saturated fat
-88.1%
Contains
more
Mono. Fat Monounsaturated fat
+1469.8%
Contains
more
Poly. Fat Polyunsaturated fat
+568.3%