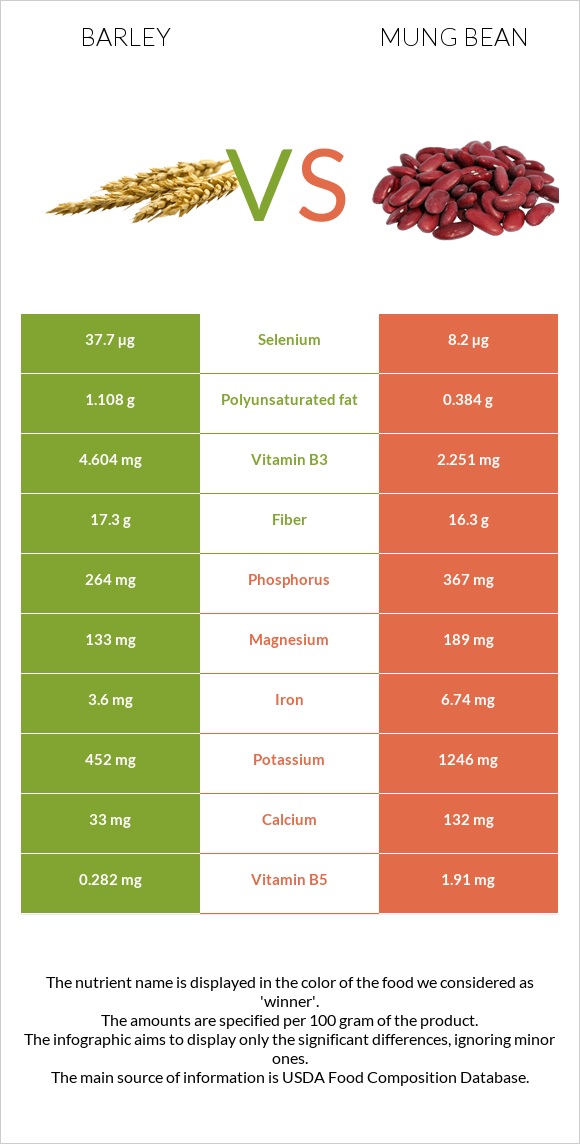
The main differences between barley and mung beans Barley has more selenium, manganese, and vitamin B3; however, mung beans have more folate, copper, iron, vitamin B5, potassium, phosphorus, and magnesium. Daily need coverage for folate for mung beans is 152% higher. Mung beans have 5 times less selenium than barley. Barley has 37.7µg of selenium, while mung beans have 8.2µg. Food types used in this article are Barley, hulled and Mung beans, mature seeds, raw .
Infographic
Mineral Comparison
Mineral comparison score is based on the number of minerals by which one or the other food is richer. The "coverage" charts below show how much of the daily needs can be covered by 300 grams of the food.
3
100 g
300 g
1 cup - 184g
Magnesium
Magnesium
Calcium
Calcium
Potassium
Potassium
Iron
Iron
Copper
Copper
Zinc
Zinc
Phosphorus
Phosphorus
Sodium
Sodium
Manganese
Manganese
Selenium
Selenium
95%
9.9%
40%
135%
166%
76%
113%
1.6%
253%
206%
6
100 g
300 g
1 tbsp - 13g 1 cup - 207g
Magnesium
Magnesium
Calcium
Calcium
Potassium
Potassium
Iron
Iron
Copper
Copper
Zinc
Zinc
Phosphorus
Phosphorus
Sodium
Sodium
Manganese
Manganese
Selenium
Selenium
135%
40%
110%
253%
314%
73%
157%
2%
135%
45%
Vitamin Comparison
Vitamin comparison score is based on the number of vitamins by which one or the other food is richer. The "coverage" charts below show how much of the daily needs can be covered by 300 grams of the food.
3
100 g
300 g
1 cup - 184g
Vitamin C
Vit. C
Vitamin D
Vit. D
Vitamin A
Vit. A
Vitamin E
Vit. E
Vitamin B1
Vit. B1
Vitamin B2
Vit. B2
Vitamin B3
Vit. B3
Vitamin B5
Vit. B5
Vitamin B6
Vit. B6
Vitamin B12
Vit. B12
Vitamin K
Vit. K
Folate
Folate
0%
0%
0.33%
11%
162%
66%
86%
17%
73%
0%
5.5%
14%
6
100 g
300 g
1 tbsp - 13g 1 cup - 207g
Vitamin C
Vit. C
Vitamin D
Vit. D
Vitamin A
Vit. A
Vitamin E
Vit. E
Vitamin B1
Vit. B1
Vitamin B2
Vit. B2
Vitamin B3
Vit. B3
Vitamin B5
Vit. B5
Vitamin B6
Vit. B6
Vitamin B12
Vit. B12
Vitamin K
Vit. K
Folate
Folate
16%
0%
2%
10%
155%
54%
42%
115%
88%
0%
23%
469%
All nutrients comparison - raw data values
Nutrient
DV% diff.
Folate
19µg
625µg
152%
Selenium
37.7µg
8.2µg
54%
Copper
0.498mg
0.941mg
49%
Iron
3.6mg
6.74mg
39%
Manganese
1.943mg
1.035mg
39%
Vitamin B5
0.282mg
1.91mg
33%
Protein
12.48g
23.86g
23%
Potassium
452mg
1246mg
23%
Choline
97.9mg
18%
Phosphorus
264mg
367mg
15%
Vitamin B3
4.604mg
2.251mg
15%
Magnesium
133mg
189mg
13%
Calcium
33mg
132mg
10%
Vitamin K
2.2µg
9µg
6%
Vitamin C
0mg
4.8mg
5%
Vitamin B6
0.318mg
0.382mg
5%
Polyunsaturated fat
1.108g
0.384g
5%
Carbs
73.48g
62.62g
4%
Fiber
17.3g
16.3g
4%
Vitamin B2
0.285mg
0.233mg
4%
Fats
2.3g
1.15g
2%
Vitamin B1
0.646mg
0.621mg
2%
Zinc
2.77mg
2.68mg
1%
Vitamin A
1µg
6µg
1%
Saturated fat
0.482g
0.348g
1%
Calories
354kcal
347kcal
0%
Protein per 100 calories
3.5g
6.9g
N/A
Calories per 10 g protein
284kcal
145kcal
N/A
Weight per 100 calories
28g
29g
N/A
Unsaturated / Saturated Fat ratio
2.9
1.6
N/A
Net carbs
56.18g
46.32g
N/A
Sugar
0.8g
6.6g
N/A
Sodium
12mg
15mg
0%
Vitamin E
0.57mg
0.51mg
0%
Monounsaturated fat
0.295g
0.161g
0%
Tryptophan
0.208mg
0.26mg
0%
Threonine
0.424mg
0.782mg
0%
Isoleucine
0.456mg
1.008mg
0%
Leucine
0.848mg
1.847mg
0%
Lysine
0.465mg
1.664mg
0%
Methionine
0.24mg
0.286mg
0%
Phenylalanine
0.7mg
1.443mg
0%
Valine
0.612mg
1.237mg
0%
Histidine
0.281mg
0.695mg
0%
Macronutrient Comparison
Macronutrient breakdown side-by-side comparison
3
12%
2%
73%
9%
2%
Protein:
12.48 g
Fats:
2.3 g
Carbs:
73.48 g
Water:
9.44 g
Other:
2.3 g
2
24%
63%
9%
3%
Protein:
23.86 g
Fats:
1.15 g
Carbs:
62.62 g
Water:
9.05 g
Other:
3.32 g
Contains
more
Fats Fats
+100%
Contains
more
Carbs Carbs
+17.3%
Contains
more
Protein Protein
+91.2%
Contains
more
Other Other
+44.3%
Fat Type Comparison
Fat type breakdown side-by-side comparison
2
26%
16%
59%
Saturated fat:
Sat. Fat
0.482 g
Monounsaturated fat:
Mono. Fat
0.295 g
Polyunsaturated fat:
Poly. Fat
1.108 g
1
39%
18%
43%
Saturated fat:
Sat. Fat
0.348 g
Monounsaturated fat:
Mono. Fat
0.161 g
Polyunsaturated fat:
Poly. Fat
0.384 g
Contains
more
Mono. Fat Monounsaturated fat
+83.2%
Contains
more
Poly. Fat Polyunsaturated fat
+188.5%
Contains
less
Sat. Fat Saturated fat
-27.8%