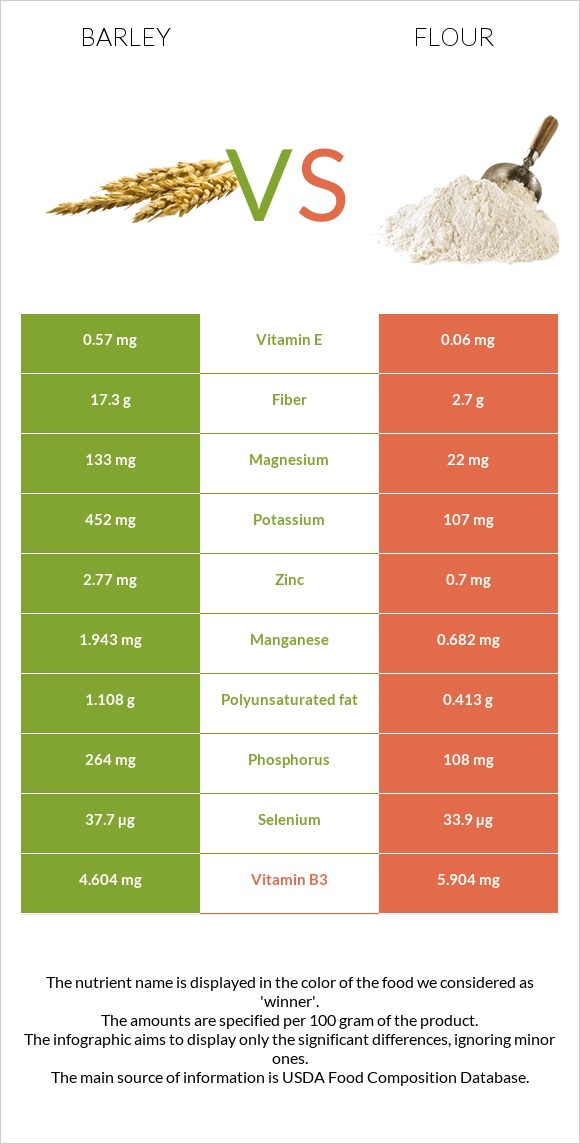
A recap on the differences between barley and flour Barley has more fiber, manganese, copper, magnesium, phosphorus, vitamin B6, and zinc; however, flour is higher in folate, vitamin B2, and iron. Barley covers your daily fiber needs 58% more than flour. Flour contains 7 times less vitamin B6 than barley. Barley contains 0.318mg of vitamin B6, while flour contains 0.044mg. The glycemic index of flour is higher. Food varieties used in this article are Barley, hulled and Wheat flour, white, all-purpose, enriched, bleached .
Infographic
Mineral Comparison
Mineral comparison score is based on the number of minerals by which one or the other food is richer. The "coverage" charts below show how much of the daily needs can be covered by 300 grams of the food.
8
100 g
300 g
1 cup - 184g
Magnesium
Magnesium
Calcium
Calcium
Potassium
Potassium
Iron
Iron
Copper
Copper
Zinc
Zinc
Phosphorus
Phosphorus
Sodium
Sodium
Manganese
Manganese
Selenium
Selenium
95%
9.9%
40%
135%
166%
76%
113%
1.6%
253%
206%
2
100 g
300 g
1 cup - 125g
Magnesium
Magnesium
Calcium
Calcium
Potassium
Potassium
Iron
Iron
Copper
Copper
Zinc
Zinc
Phosphorus
Phosphorus
Sodium
Sodium
Manganese
Manganese
Selenium
Selenium
16%
4.5%
9.4%
174%
48%
19%
46%
0.26%
89%
185%
Vitamin Comparison
Vitamin comparison score is based on the number of vitamins by which one or the other food is richer. The "coverage" charts below show how much of the daily needs can be covered by 300 grams of the food.
4
100 g
300 g
1 cup - 184g
Vitamin C
Vit. C
Vitamin D
Vit. D
Vitamin A
Vit. A
Vitamin E
Vit. E
Vitamin B1
Vit. B1
Vitamin B2
Vit. B2
Vitamin B3
Vit. B3
Vitamin B5
Vit. B5
Vitamin B6
Vit. B6
Vitamin B12
Vit. B12
Vitamin K
Vit. K
Folate
Folate
0%
0%
0.33%
11%
162%
66%
86%
17%
73%
0%
5.5%
14%
5
100 g
300 g
1 cup - 125g
Vitamin C
Vit. C
Vitamin D
Vit. D
Vitamin A
Vit. A
Vitamin E
Vit. E
Vitamin B1
Vit. B1
Vitamin B2
Vit. B2
Vitamin B3
Vit. B3
Vitamin B5
Vit. B5
Vitamin B6
Vit. B6
Vitamin B12
Vit. B12
Vitamin K
Vit. K
Folate
Folate
0%
0%
0%
1.2%
196%
114%
111%
26%
10%
0%
0.75%
137%
All nutrients comparison - raw data values
Nutrient
DV% diff.
Fiber
17.3g
2.7g
58%
Manganese
1.943mg
0.682mg
55%
Folate
19µg
183µg
41%
Copper
0.498mg
0.144mg
39%
Magnesium
133mg
22mg
26%
Phosphorus
264mg
108mg
22%
Vitamin B6
0.318mg
0.044mg
21%
Zinc
2.77mg
0.7mg
19%
Vitamin B2
0.285mg
0.494mg
16%
Iron
3.6mg
4.64mg
13%
Vitamin B1
0.646mg
0.785mg
12%
Potassium
452mg
107mg
10%
Vitamin B3
4.604mg
5.904mg
8%
Selenium
37.7µg
33.9µg
7%
Polyunsaturated fat
1.108g
0.413g
5%
Protein
12.48g
10.33g
4%
Vitamin E
0.57mg
0.06mg
3%
Vitamin B5
0.282mg
0.438mg
3%
Fats
2.3g
0.98g
2%
Calcium
33mg
15mg
2%
Vitamin K
2.2µg
0.3µg
2%
Choline
10.4mg
2%
Calories
354kcal
364kcal
1%
Carbs
73.48g
76.31g
1%
Saturated fat
0.482g
0.155g
1%
Monounsaturated fat
0.295g
0.087g
1%
Protein per 100 calories
3.5g
2.8g
N/A
Calories per 10 g protein
284kcal
352kcal
N/A
Weight per 100 calories
28g
27g
N/A
Unsaturated / Saturated Fat ratio
2.9
3.2
N/A
Net carbs
56.18g
73.61g
N/A
Sugar
0.8g
0.27g
N/A
Sodium
12mg
2mg
0%
Vitamin A
1µg
0µg
0%
Tryptophan
0.208mg
0.127mg
0%
Threonine
0.424mg
0.281mg
0%
Isoleucine
0.456mg
0.357mg
0%
Leucine
0.848mg
0.71mg
0%
Lysine
0.465mg
0.228mg
0%
Methionine
0.24mg
0.183mg
0%
Phenylalanine
0.7mg
0.52mg
0%
Valine
0.612mg
0.415mg
0%
Histidine
0.281mg
0.23mg
0%
Macronutrient Comparison
Macronutrient breakdown side-by-side comparison
3
12%
2%
73%
9%
2%
Protein:
12.48 g
Fats:
2.3 g
Carbs:
73.48 g
Water:
9.44 g
Other:
2.3 g
2
10%
76%
12%
Protein:
10.33 g
Fats:
0.98 g
Carbs:
76.31 g
Water:
11.92 g
Other:
0.46 g
Contains
more
Protein Protein
+20.8%
Contains
more
Fats Fats
+134.7%
Contains
more
Other Other
+400%
Contains
more
Water Water
+26.3%
Fat Type Comparison
Fat type breakdown side-by-side comparison
2
26%
16%
59%
Saturated fat:
Sat. Fat
0.482 g
Monounsaturated fat:
Mono. Fat
0.295 g
Polyunsaturated fat:
Poly. Fat
1.108 g
1
24%
13%
63%
Saturated fat:
Sat. Fat
0.155 g
Monounsaturated fat:
Mono. Fat
0.087 g
Polyunsaturated fat:
Poly. Fat
0.413 g
Contains
more
Mono. Fat Monounsaturated fat
+239.1%
Contains
more
Poly. Fat Polyunsaturated fat
+168.3%
Contains
less
Sat. Fat Saturated fat
-67.8%