Barley vs. Spelt — Health Impact and Nutrition Comparison


Summary
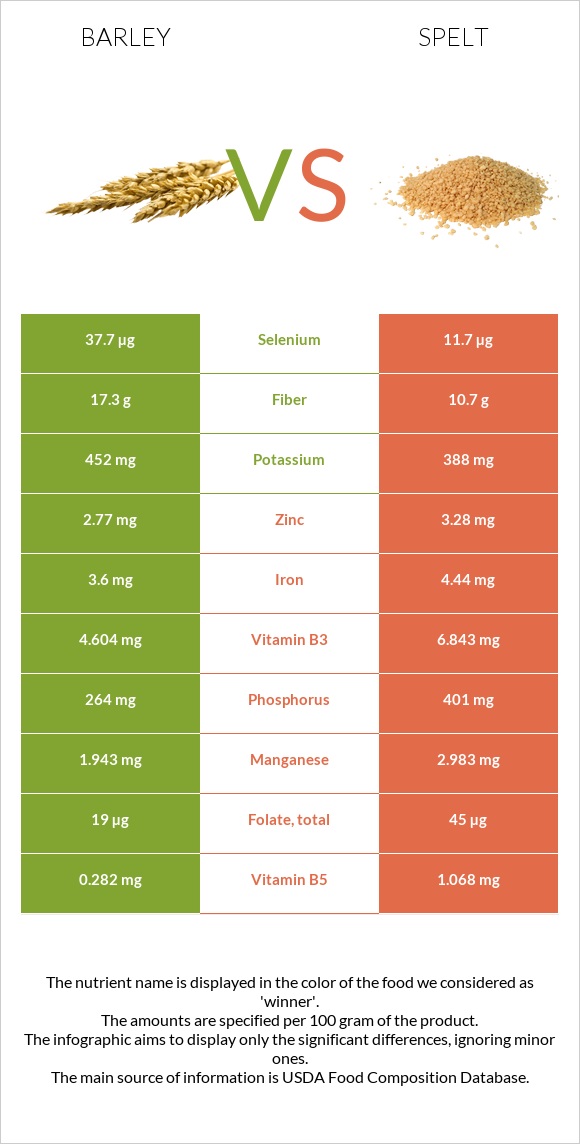
Barley has a lower glycemic index and is richer in selenium and vitamin B6. In comparison, spelt is lower in carbs. It is richer in zinc, iron, phosphorus, manganese, copper, and vitamins B1 and B3.
Introduction
In this article, we will discuss the differences between barley and spelt. These differences are in nutritional content and health impacts.
By the end of this article, we will understand the differences between barley and spelt, which one is nutritiously denser, and their health impacts.
Nutritional content comparison
In this section, the comparison of these grains will be in their uncooked form.
Calories
Barley and spelt have similar amounts of calories.
Glycemic index
Spelt has a higher glycemic index compared to barley. The difference is very significanct.
The glycemic index of barley is 28, whereas the glycemic index of spelt is 63.
Since the difference in glycemic index is significant in both these articles concerning spelt nutrition and barley nutrition, you can check their nutritional contents and glycemic indices in-depth.
Carbs
The carb profile of both is similar however, barley contains slightly higher amounts of carbs. It contains 28g of carbs, and in comparison, spelt contains 26g of carbs.
Fibers
They have nearly similar amounts of fibers.
Fats
The fat content of both is similar and negligible.
Proteins
Spelt is richer in proteins compared to barley. 5.5g of protein for spelt and 2.3g of protein for barley.
Minerals
Barley is richer in selenium. In comparison, spelt is richer in zinc, iron, manganese, copper and phosphorus.
Below we can visualize the mineral distribution of barley and spelt.
Mineral Comparison
Contains
less
SodiumSodium
-40%
Contains
more
SeleniumSelenium
+115%
Contains
more
MagnesiumMagnesium
+122.7%
Contains
more
PotassiumPotassium
+53.8%
Contains
more
IronIron
+25.6%
Contains
more
CopperCopper
+104.8%
Contains
more
ZincZinc
+52.4%
Contains
more
PhosphorusPhosphorus
+177.8%
Contains
more
ManganeseManganese
+321.2%
Vitamins
Barley is richer in vitamin B6. In comparison, spelt is richer in vitamins B1 and B3.
Below we can visualize the vitamin distribution of barley and spelt.
Vitamin Comparison
Contains
more
Vitamin B2Vitamin B2
+106.7%
Contains
more
Vitamin B5Vitamin B5
+∞%
Contains
more
Vitamin B6Vitamin B6
+43.8%
Contains
more
Vitamin KVitamin K
+∞%
Contains
more
FolateFolate
+23.1%
Contains
more
Vitamin EVitamin E
+2500%
Contains
more
Vitamin B1Vitamin B1
+24.1%
Contains
more
Vitamin B3Vitamin B3
+24.6%
Health impacts
Gluten intolerance and celiac disease
Both grains contain gluten.
Gluten consumption for people with celiac disease or gluten intolerance will trigger the disease; thus, avoiding gluten-containing foods is important. (1)
Diabetes
Compared to spelt, barley is a better choice for diabetic or prediabetic individuals.
Since barley has a lower glycemic index, it is advised to include it in the diet of prediabetic and diabetic individuals. (2)
Irritable bowel syndrome
Spelt and barley are high in FODMAP, poorly absorbed sugars, which will likely trigger the symptoms of IBS. (3)
Infographic

All nutrients comparison - raw data values
| Nutrient |  |
 |
DV% diff. |
| Manganese | 0.259mg | 1.091mg | 36% |
| Phosphorus | 54mg | 150mg | 14% |
| Copper | 0.105mg | 0.215mg | 12% |
| Starch | 19.57g | 8% | |
| Selenium | 8.6µg | 4µg | 8% |
| Protein | 2.26g | 5.5g | 6% |
| Magnesium | 22mg | 49mg | 6% |
| Iron | 1.33mg | 1.67mg | 4% |
| Zinc | 0.82mg | 1.25mg | 4% |
| Vitamin B3 | 2.063mg | 2.57mg | 3% |
| Vitamin B5 | 0.135mg | 3% | |
| Vitamin B6 | 0.115mg | 0.08mg | 3% |
| Vitamin E | 0.01mg | 0.26mg | 2% |
| Vitamin B1 | 0.083mg | 0.103mg | 2% |
| Vitamin B2 | 0.062mg | 0.03mg | 2% |
| Choline | 13.4mg | 2% | |
| Fats | 0.44g | 0.85g | 1% |
| Carbs | 28.22g | 26.44g | 1% |
| Potassium | 93mg | 143mg | 1% |
| Vitamin K | 0.8µg | 1% | |
| Folate | 16µg | 13µg | 1% |
| Polyunsaturated fat | 0.214g | 1% | |
| Calories | 123kcal | 127kcal | 0% |
| Net carbs | 24.42g | 22.54g | N/A |
| Calcium | 11mg | 10mg | 0% |
| Sugar | 0.28g | N/A | |
| Fiber | 3.8g | 3.9g | 0% |
| Sodium | 3mg | 5mg | 0% |
| Saturated fat | 0.093g | 0% | |
| Monounsaturated fat | 0.057g | 0% | |
| Tryptophan | 0.038mg | 0% | |
| Threonine | 0.077mg | 0% | |
| Isoleucine | 0.083mg | 0% | |
| Leucine | 0.154mg | 0% | |
| Lysine | 0.084mg | 0% | |
| Methionine | 0.043mg | 0% | |
| Phenylalanine | 0.127mg | 0% | |
| Valine | 0.111mg | 0% | |
| Histidine | 0.051mg | 0% |
Macronutrient Comparison
| Contains more ProteinProtein | +143.4% |
| Contains more FatsFats | +93.2% |
| Contains more OtherOther | +132.1% |
People also compare
References
All the values for which the sources are not specified explicitly are taken from FDA’s Food Central. The exact link to the food presented on this page can be found below.
- Barley - https://fdc.nal.usda.gov/fdc-app.html#/food-details/170285/nutrients
- Spelt - https://fdc.nal.usda.gov/fdc-app.html#/food-details/169746/nutrients
All the Daily Values are presented for males aged 31-50, for 2000-calorie diets.


