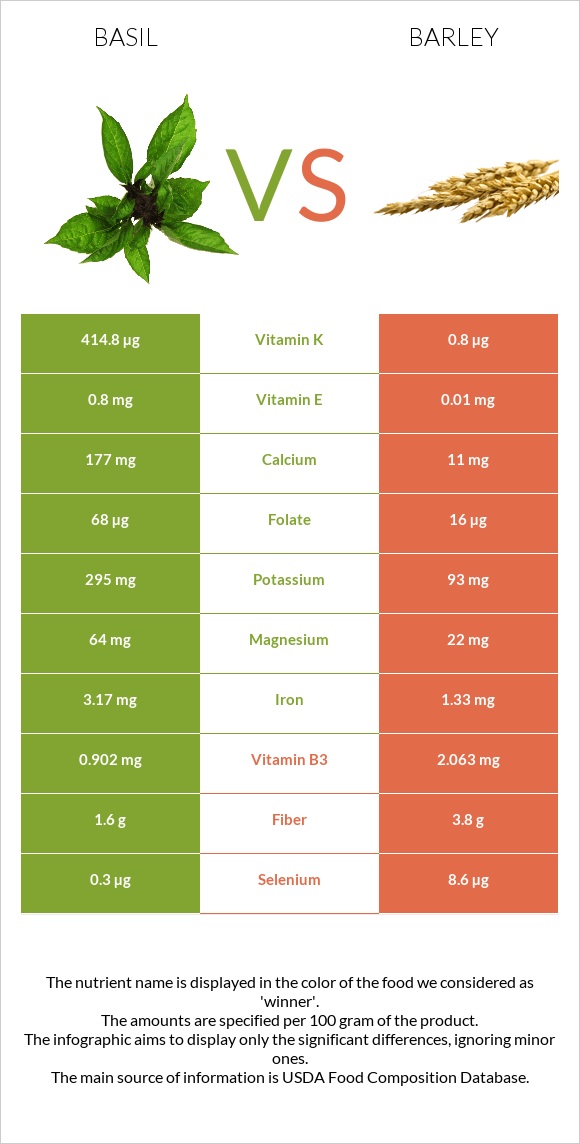
Significant differences between basil and barley Basil has more vitamin K, vitamin A, manganese, copper, iron, vitamin C, calcium, folate, and magnesium; however, barley is richer in selenium. Basil covers your daily vitamin K needs 345% more than barley. Basil has a higher glycemic index. The glycemic index of basil is 70, while the glycemic index of barley is 28. Specific food types used in this comparison are Basil, fresh and Barley, pearled, cooked .
Infographic
Mineral Comparison
Mineral comparison score is based on the number of minerals by which one or the other food is richer. The "coverage" charts below show how much of the daily needs can be covered by 300 grams of the food.
6
100 g
300 g
5 leaves - 2.5g 2 tbsp, chopped - 5.3g 0.25 cup leaves, whole - 6g
Magnesium
Magnesium
Calcium
Calcium
Potassium
Potassium
Iron
Iron
Copper
Copper
Zinc
Zinc
Phosphorus
Phosphorus
Sodium
Sodium
Manganese
Manganese
Selenium
Selenium
46%
53%
26%
119%
128%
22%
24%
0.52%
150%
1.6%
2
100 g
300 g
1 cup - 157g
Magnesium
Magnesium
Calcium
Calcium
Potassium
Potassium
Iron
Iron
Copper
Copper
Zinc
Zinc
Phosphorus
Phosphorus
Sodium
Sodium
Manganese
Manganese
Selenium
Selenium
16%
3.3%
8.2%
50%
35%
22%
23%
0.39%
34%
47%
Vitamin Comparison
Vitamin comparison score is based on the number of vitamins by which one or the other food is richer. The "coverage" charts below show how much of the daily needs can be covered by 300 grams of the food.
8
100 g
300 g
5 leaves - 2.5g 2 tbsp, chopped - 5.3g 0.25 cup leaves, whole - 6g
Vitamin C
Vit. C
Vitamin D
Vit. D
Vitamin A
Vit. A
Vitamin E
Vit. E
Vitamin B1
Vit. B1
Vitamin B2
Vit. B2
Vitamin B3
Vit. B3
Vitamin B5
Vit. B5
Vitamin B6
Vit. B6
Vitamin B12
Vit. B12
Vitamin K
Vit. K
Folate
Folate
60%
0%
88%
16%
8.5%
18%
17%
13%
36%
0%
1037%
51%
2
100 g
300 g
1 cup - 157g
Vitamin C
Vit. C
Vitamin D
Vit. D
Vitamin A
Vit. A
Vitamin E
Vit. E
Vitamin B1
Vit. B1
Vitamin B2
Vit. B2
Vitamin B3
Vit. B3
Vitamin B5
Vit. B5
Vitamin B6
Vit. B6
Vitamin B12
Vit. B12
Vitamin K
Vit. K
Folate
Folate
0%
0%
0%
0.2%
21%
14%
39%
8.1%
27%
0%
2%
12%
All nutrients comparison - raw data values
Nutrient
DV% diff.
Vitamin K
414.8µg
0.8µg
345%
Manganese
1.148mg
0.259mg
39%
Copper
0.385mg
0.105mg
31%
Vitamin A
264µg
0µg
29%
Iron
3.17mg
1.33mg
23%
Vitamin C
18mg
0mg
20%
Calcium
177mg
11mg
17%
Selenium
0.3µg
8.6µg
15%
Folate
68µg
16µg
13%
Magnesium
64mg
22mg
10%
Carbs
2.65g
28.22g
9%
Fiber
1.6g
3.8g
9%
Vitamin B3
0.902mg
2.063mg
7%
Potassium
295mg
93mg
6%
Calories
23kcal
123kcal
5%
Vitamin E
0.8mg
0.01mg
5%
Vitamin B1
0.034mg
0.083mg
4%
Vitamin B6
0.155mg
0.115mg
3%
Protein
3.15g
2.26g
2%
Vitamin B2
0.076mg
0.062mg
1%
Vitamin B5
0.209mg
0.135mg
1%
Polyunsaturated fat
0.389g
0.214g
1%
Protein per 100 calories
14g
1.8g
N/A
Calories per 10 g protein
73kcal
544kcal
N/A
Weight per 100 calories
435g
81g
N/A
Fats
0.64g
0.44g
0%
Net carbs
1.05g
24.42g
N/A
Sugar
0.3g
0.28g
N/A
Zinc
0.81mg
0.82mg
0%
Phosphorus
56mg
54mg
0%
Sodium
4mg
3mg
0%
Choline
11.4mg
13.4mg
0%
Saturated fat
0.041g
0.093g
0%
Monounsaturated fat
0.088g
0.057g
0%
Tryptophan
0.039mg
0.038mg
0%
Threonine
0.104mg
0.077mg
0%
Isoleucine
0.104mg
0.083mg
0%
Leucine
0.191mg
0.154mg
0%
Lysine
0.11mg
0.084mg
0%
Methionine
0.036mg
0.043mg
0%
Phenylalanine
0.13mg
0.127mg
0%
Valine
0.127mg
0.111mg
0%
Histidine
0.051mg
0.051mg
0%
Fructose
0.02g
0%
Macronutrient Comparison
Macronutrient breakdown side-by-side comparison
4
3%
3%
92%
Protein:
3.15 g
Fats:
0.64 g
Carbs:
2.65 g
Water:
92.06 g
Other:
1.5 g
1
2%
28%
69%
Protein:
2.26 g
Fats:
0.44 g
Carbs:
28.22 g
Water:
68.8 g
Other:
0.28 g
Contains
more
Protein Protein
+39.4%
Contains
more
Fats Fats
+45.5%
Contains
more
Water Water
+33.8%
Contains
more
Other Other
+435.7%
Contains
more
Carbs Carbs
+964.9%
Fat Type Comparison
Fat type breakdown side-by-side comparison
3
8%
17%
75%
Saturated fat:
Sat. Fat
0.041 g
Monounsaturated fat:
Mono. Fat
0.088 g
Polyunsaturated fat:
Poly. Fat
0.389 g
0
26%
16%
59%
Saturated fat:
Sat. Fat
0.093 g
Monounsaturated fat:
Mono. Fat
0.057 g
Polyunsaturated fat:
Poly. Fat
0.214 g
Contains
less
Sat. Fat Saturated fat
-55.9%
Contains
more
Mono. Fat Monounsaturated fat
+54.4%
Contains
more
Poly. Fat Polyunsaturated fat
+81.8%