Beef, chuck eye steak, boneless, separable lean only, trimmed to 0" fat, all grades, raw vs. Beefsteak raw — In-Depth Nutrition Comparison
Compare
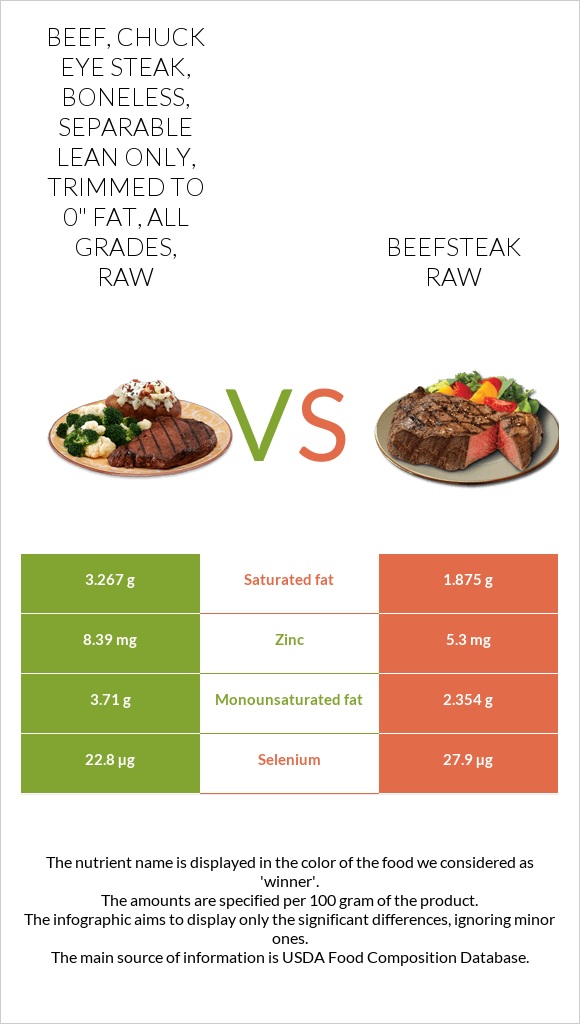
The main differences between beef, chuck eye steak, boneless, separable lean only, trimmed to 0" fat, all grades, raw and beefsteak raw
- Beef, chuck eye steak, boneless, separable lean only, trimmed to 0" fat, all grades, raw has more zinc, vitamin B12, and monounsaturated fat; however, beefsteak raw has more vitamin B6 and selenium.
- Daily need coverage for zinc for beef, chuck eye steak, boneless, separable lean only, trimmed to 0" fat, all grades, raw is 28% higher.
- Beefsteak raw has 2 times less saturated fat than beef, chuck eye steak, boneless, separable lean only, trimmed to 0" fat, all grades, raw. Beef, chuck eye steak, boneless, separable lean only, trimmed to 0" fat, all grades, raw has 3.267g of saturated fat, while beefsteak raw has 1.875g.
Food types used in this article are Beef, chuck eye steak, boneless, separable lean only, trimmed to 0" fat, all grades, raw and Beef, loin, top sirloin cap steak, boneless, separable lean only, trimmed to 1/8" fat, all grades, raw.
Infographic
Infographic link
Mineral Comparison
Mineral comparison score is based on the number of minerals by which one or the other food is richer. The "coverage" charts below show how much of the daily needs can be covered by 300 grams of the food.
| Contains more CalciumCalcium | +200% |
| Contains more IronIron | +14% |
| Contains more ZincZinc | +58.3% |
| Contains more ManganeseManganese | +∞% |
| Contains more MagnesiumMagnesium | +13.6% |
| Contains less SodiumSodium | -21.4% |
| Contains more SeleniumSelenium | +22.4% |
Vitamin Comparison
Vitamin comparison score is based on the number of vitamins by which one or the other food is richer. The "coverage" charts below show how much of the daily needs can be covered by 300 grams of the food.
| Contains more Vitamin EVitamin E | +∞% |
| Contains more Vitamin B5Vitamin B5 | +∞% |
| Contains more Vitamin B12Vitamin B12 | +14.1% |
| Contains more Vitamin B6Vitamin B6 | +38.5% |
All nutrients comparison - raw data values
| Nutrient |  |
 |
DV% diff. |
| Zinc | 8.39mg | 5.3mg | 28% |
| Vitamin B12 | 3.07µg | 2.69µg | 16% |
| Vitamin B5 | 0.73mg | 15% | |
| Choline | 73.4mg | 13% | |
| Vitamin B6 | 0.392mg | 0.543mg | 12% |
| Selenium | 22.8µg | 27.9µg | 9% |
| Saturated fat | 3.267g | 1.875g | 6% |
| Iron | 2.28mg | 2mg | 4% |
| Fats | 7.56g | 5.36g | 3% |
| Phosphorus | 202mg | 220mg | 3% |
| Monounsaturated fat | 3.71g | 2.354g | 3% |
| Calories | 153kcal | 134kcal | 1% |
| Magnesium | 22mg | 25mg | 1% |
| Calcium | 15mg | 5mg | 1% |
| Copper | 0.072mg | 0.079mg | 1% |
| Sodium | 70mg | 55mg | 1% |
| Vitamin E | 0.17mg | 1% | |
| Vitamin B2 | 0.17mg | 0.182mg | 1% |
| Vitamin B3 | 4.827mg | 5.048mg | 1% |
| Polyunsaturated fat | 0.372g | 0.189g | 1% |
| Protein | 21.29g | 21.38g | 0% |
| Protein per 100 calories | 14g | 16g | N/A |
| Calories per 10 g protein | 72kcal | 63kcal | N/A |
| Weight per 100 calories | 65g | 75g | N/A |
| Unsaturated / Saturated Fat ratio | 1.2 | 1.4 | N/A |
| Cholesterol | 67mg | 67mg | 0% |
| Vitamin D* | 4 IU | 3 IU | 0% |
| Vitamin D | 0.1µg | 0.1µg | 0% |
| Potassium | 371mg | 375mg | 0% |
| Vitamin A | 2µg | 2µg | 0% |
| Manganese | 0.01mg | 0% | |
| Vitamin B1 | 0.075mg | 0.075mg | 0% |
| Vitamin K | 1.5µg | 1.5µg | 0% |
| Folate | 3µg | 3µg | 0% |
| Trans fat | 0.414g | 0.253g | N/A |
| Tryptophan | 0.244mg | 0.262mg | 0% |
| Threonine | 0.964mg | 1.099mg | 0% |
| Isoleucine | 0.932mg | 1.09mg | 0% |
| Leucine | 1.763mg | 2.011mg | 0% |
| Lysine | 1.916mg | 2.247mg | 0% |
| Methionine | 0.621mg | 0.621mg | 0% |
| Phenylalanine | 0.83mg | 0.931mg | 0% |
| Valine | 0.985mg | 1.152mg | 0% |
| Histidine | 0.702mg | 0.868mg | 0% |
| Omega-3 - EPA | 0.001g | 0g | N/A |
| Omega-3 - ALA | 0.014g | N/A | |
| Omega-3 - DPA | 0g | 0.008g | N/A |
| Omega-6 - Gamma-linoleic acid | 0.007g | N/A | |
| Omega-6 - Linoleic acid | 0.292g | 0.142g | N/A |
Macronutrient Comparison
Macronutrient breakdown side-by-side comparison
Protein:
21.29 g
Fats:
7.56 g
Carbs:
0 g
Water:
70.25 g
Other:
0.9 g
Protein:
21.38 g
Fats:
5.36 g
Carbs:
0 g
Water:
72.93 g
Other:
0.33 g
| Contains more FatsFats | +41% |
| Contains more OtherOther | +172.7% |
~equal in
Protein
~21.38g
~equal in
Carbs
~0g
~equal in
Water
~72.93g
Fat Type Comparison
Fat type breakdown side-by-side comparison
Saturated fat:
Sat. Fat
3.267 g
Monounsaturated fat:
Mono. Fat
3.71 g
Polyunsaturated fat:
Poly. Fat
0.372 g
Saturated fat:
Sat. Fat
1.875 g
Monounsaturated fat:
Mono. Fat
2.354 g
Polyunsaturated fat:
Poly. Fat
0.189 g
| Contains more Mono. FatMonounsaturated fat | +57.6% |
| Contains more Poly. FatPolyunsaturated fat | +96.8% |
| Contains less Sat. FatSaturated fat | -42.6% |