Beverages, drink mix, QUAKER OATS, GATORADE, orange flavor, powder vs. Rockstar — In-Depth Nutrition Comparison
Compare
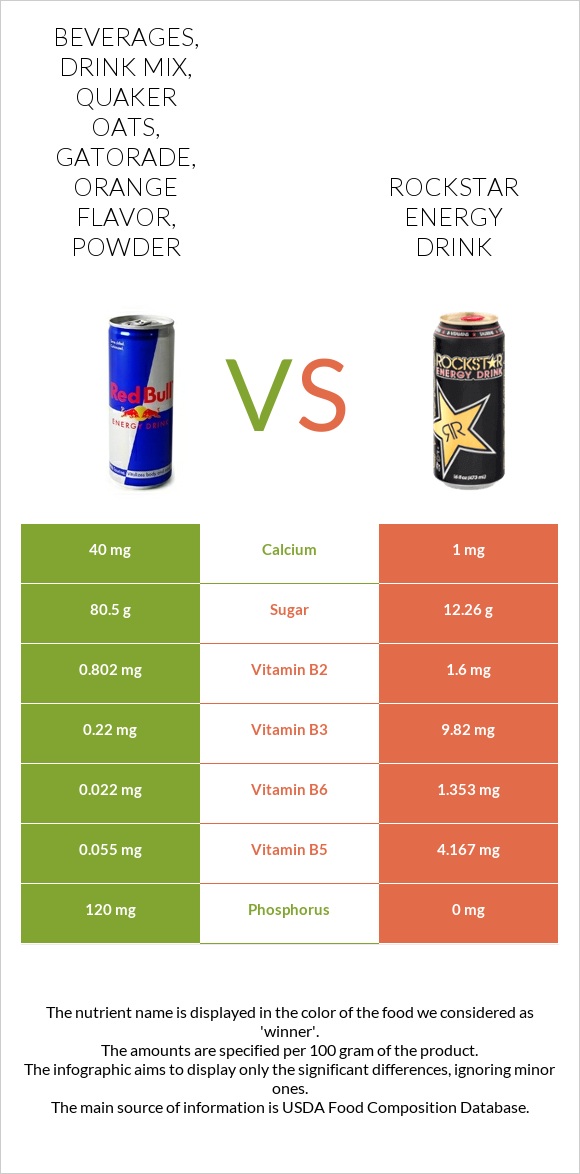
How are beverages, drink mix, QUAKER OATS, GATORADE, orange flavor, powder and Rockstar different?
- Beverages, drink mix, QUAKER OATS, GATORADE, orange flavor, powder is higher in copper and phosphorus; however, Rockstar is richer in vitamin B6, vitamin B5, vitamin B2, and vitamin B3.
- Daily need coverage for vitamin B6 for Rockstar is 102% higher.
- Rockstar has less sugar.
Beverages, drink mix, QUAKER OATS, GATORADE, orange flavor, powder and Beverages, Energy drink, ROCKSTAR are the varieties used in this article.
Infographic
Infographic link
Mineral Comparison
Mineral comparison score is based on the number of minerals by which one or the other food is richer. The "coverage" charts below show how much of the daily needs can be covered by 300 grams of the food.
| Contains more MagnesiumMagnesium | +∞% |
| Contains more CalciumCalcium | +3900% |
| Contains more PotassiumPotassium | +400% |
| Contains more IronIron | +580% |
| Contains more CopperCopper | +∞% |
| Contains more ZincZinc | +20% |
| Contains more PhosphorusPhosphorus | +∞% |
| Contains more ManganeseManganese | +∞% |
| Contains less SodiumSodium | -74.6% |
Vitamin Comparison
Vitamin comparison score is based on the number of vitamins by which one or the other food is richer. The "coverage" charts below show how much of the daily needs can be covered by 300 grams of the food.
| Contains more Vitamin CVitamin C | +∞% |
| Contains more Vitamin B1Vitamin B1 | +∞% |
| Contains more Vitamin B2Vitamin B2 | +99.5% |
| Contains more Vitamin B3Vitamin B3 | +4363.6% |
| Contains more Vitamin B5Vitamin B5 | +7476.4% |
| Contains more Vitamin B6Vitamin B6 | +6050% |
All nutrients comparison - raw data values
| Nutrient |  |
 |
DV% diff. |
| Vitamin B12 | 3.77µg | 157% | |
| Vitamin B6 | 0.022mg | 1.353mg | 102% |
| Vitamin B5 | 0.055mg | 4.167mg | 82% |
| Vitamin B2 | 0.802mg | 1.6mg | 61% |
| Vitamin B3 | 0.22mg | 9.82mg | 60% |
| Copper | 0.25mg | 0mg | 28% |
| Carbs | 94.11g | 12.7g | 27% |
| Calories | 388kcal | 58kcal | 17% |
| Phosphorus | 120mg | 0mg | 17% |
| Caffeine | 33mg | 8% | |
| Calcium | 40mg | 1mg | 4% |
| Iron | 0.34mg | 0.05mg | 4% |
| Fructose | 0.2g | 3.59g | 4% |
| Fats | 1.23g | 0.22g | 2% |
| Sodium | 63mg | 16mg | 2% |
| Manganese | 0.05mg | 0mg | 2% |
| Protein | 0g | 0.34g | 1% |
| Potassium | 30mg | 6mg | 1% |
| Vitamin B1 | 0.011mg | 0mg | 1% |
| Weight per 100 calories | 26g | 172g | N/A |
| Vitamin C | 0.4mg | 0mg | 0% |
| Net carbs | 94.11g | 12.7g | N/A |
| Magnesium | 1mg | 0mg | 0% |
| Sugar | 80.5g | 12.26g | N/A |
| Zinc | 0.06mg | 0.05mg | 0% |
| Choline | 0.3mg | 0% |
Macronutrient Comparison
Macronutrient breakdown side-by-side comparison
Protein:
0 g
Fats:
1.23 g
Carbs:
94.11 g
Water:
2.51 g
Other:
2.15 g
Protein:
0.34 g
Fats:
0.22 g
Carbs:
12.7 g
Water:
87.08 g
Other:
0 g
| Contains more FatsFats | +459.1% |
| Contains more CarbsCarbs | +641% |
| Contains more OtherOther | +∞% |
| Contains more ProteinProtein | +∞% |
| Contains more WaterWater | +3369.3% |
Carbohydrate type comparison
Carbohydrate type breakdown side-by-side comparison
Starch:
0 g
Sucrose:
59.9 g
Glucose:
20 g
Fructose:
0.2 g
Lactose:
0.2 g
Maltose:
0.2 g
Galactose:
0 g
Starch:
0 g
Sucrose:
2.65 g
Glucose:
6.03 g
Fructose:
3.59 g
Lactose:
0 g
Maltose:
0 g
Galactose:
0 g
| Contains more SucroseSucrose | +2160.4% |
| Contains more GlucoseGlucose | +231.7% |
| Contains more LactoseLactose | +∞% |
| Contains more MaltoseMaltose | +∞% |
| Contains more FructoseFructose | +1695% |
~equal in
Starch
~0g
~equal in
Galactose
~0g