Beverages, Fruit flavored drink, reduced sugar, greater than 3% fruit juice, high vitamin C, added calcium vs. Coca-Cola — In-Depth Nutrition Comparison
Compare
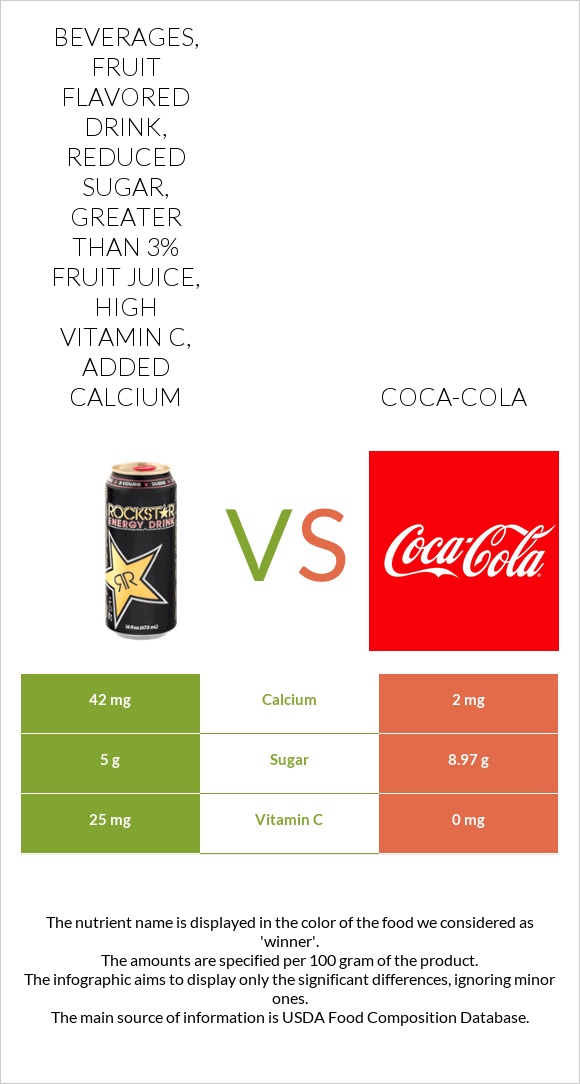
What are the differences between beverages, Fruit flavored drink, reduced sugar, greater than 3% fruit juice, high vitamin C, added calcium and Coca-Cola?
- Beverages, Fruit flavored drink, reduced sugar, greater than 3% fruit juice, high vitamin C, added calcium is richer than Coca-Cola in vitamin C.
- Beverages, Fruit flavored drink, reduced sugar, greater than 3% fruit juice, high vitamin C, added calcium's daily need coverage for vitamin C is 28% more.
- Beverages, Fruit flavored drink, reduced sugar, greater than 3% fruit juice, high vitamin C, added calcium has 21 times more calcium than Coca-Cola. While beverages, Fruit flavored drink, reduced sugar, greater than 3% fruit juice, high vitamin C, added calcium has 42mg of calcium, Coca-Cola has only 2mg.
- The amount of sugar in beverages, Fruit flavored drink, reduced sugar, greater than 3% fruit juice, high vitamin C, added calcium is lower.
We used Beverages, Fruit flavored drink, reduced sugar, greater than 3% fruit juice, high vitamin C, added calcium and Beverages, carbonated, cola, fast-food cola types in this article.
Infographic
Infographic link
Mineral Comparison
Mineral comparison score is based on the number of minerals by which one or the other food is richer. The "coverage" charts below show how much of the daily needs can be covered by 300 grams of the food.
| Contains more MagnesiumMagnesium | +∞% |
| Contains more CalciumCalcium | +2000% |
| Contains more PotassiumPotassium | +1450% |
| Contains more ZincZinc | +100% |
| Contains more IronIron | +∞% |
| Contains more CopperCopper | +∞% |
| Contains more PhosphorusPhosphorus | +∞% |
| Contains less SodiumSodium | -84% |
| Contains more ManganeseManganese | +∞% |
Vitamin Comparison
Vitamin comparison score is based on the number of vitamins by which one or the other food is richer. The "coverage" charts below show how much of the daily needs can be covered by 300 grams of the food.
| Contains more Vitamin CVitamin C | +∞% |
| Contains more Vitamin DVitamin D | +∞% |
| Contains more FolateFolate | +∞% |
All nutrients comparison - raw data values
| Nutrient |  |
 |
DV% diff. |
| Vitamin C | 25mg | 0mg | 28% |
| Calcium | 42mg | 2mg | 4% |
| Vitamin D | 0.3µg | 0µg | 2% |
| Caffeine | 0mg | 8mg | 2% |
| Fats | 0.37g | 0.02g | 1% |
| Carbs | 6.67g | 9.56g | 1% |
| Vitamin D* | 10 IU | 0 IU | 1% |
| Potassium | 31mg | 2mg | 1% |
| Iron | 0mg | 0.11mg | 1% |
| Phosphorus | 0mg | 10mg | 1% |
| Sodium | 25mg | 4mg | 1% |
| Folate | 2µg | 0µg | 1% |
| Calories | 29kcal | 37kcal | 0% |
| Protein | 0g | 0.07g | 0% |
| Weight per 100 calories | 345g | 270g | N/A |
| Net carbs | 6.67g | 9.56g | N/A |
| Magnesium | 1mg | 0mg | 0% |
| Sugar | 5g | 8.97g | N/A |
| Copper | 0mg | 0.001mg | 0% |
| Zinc | 0.04mg | 0.02mg | 0% |
| Manganese | 0mg | 0.002mg | 0% |
| Selenium | 0.1µg | 0.1µg | 0% |
| Choline | 0.1mg | 0.3mg | 0% |
Macronutrient Comparison
Macronutrient breakdown side-by-side comparison
Protein:
0 g
Fats:
0.37 g
Carbs:
6.67 g
Water:
93 g
Other:
0 g
Protein:
0.07 g
Fats:
0.02 g
Carbs:
9.56 g
Water:
90.31 g
Other:
0.04 g
| Contains more FatsFats | +1750% |
| Contains more ProteinProtein | +∞% |
| Contains more CarbsCarbs | +43.3% |
| Contains more OtherOther | +∞% |
~equal in
Water
~90.31g