Beverages, fruit juice drink, greater than 3% fruit juice, high vitamin C and added thiamin vs. Red Bull — In-Depth Nutrition Comparison
Compare
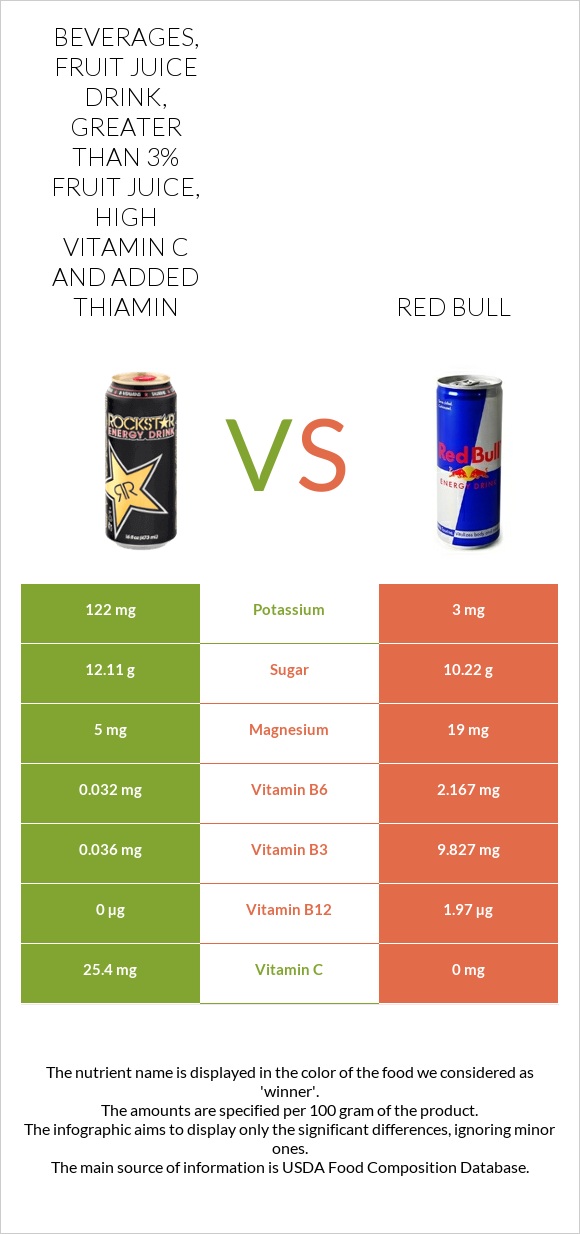
Important differences between beverages, fruit juice drink, greater than 3% fruit juice, high vitamin C and added thiamin and Red Bull
- Beverages, fruit juice drink, greater than 3% fruit juice, high vitamin C and added thiamin has more vitamin C; however, Red Bull has more vitamin B6, vitamin B12, vitamin B3, and vitamin B2.
- Red Bull's daily need coverage for vitamin B6 is 164% more.
- Red Bull is lower in sugar.
The food varieties used in the comparison are Beverages, fruit juice drink, greater than 3% fruit juice, high vitamin C and added thiamin and Beverages, Energy drink, RED BULL.
Infographic
Infographic link
Mineral Comparison
Mineral comparison score is based on the number of minerals by which one or the other food is richer. The "coverage" charts below show how much of the daily needs can be covered by 300 grams of the food.
| Contains more PotassiumPotassium | +3966.7% |
| Contains more IronIron | +316.7% |
| Contains more CopperCopper | +550% |
| Contains more ZincZinc | +300% |
| Contains more PhosphorusPhosphorus | +∞% |
| Contains more MagnesiumMagnesium | +280% |
| Contains more CalciumCalcium | +100% |
| Contains less SodiumSodium | -36.1% |
| Contains more SeleniumSelenium | +100% |
Vitamin Comparison
Vitamin comparison score is based on the number of vitamins by which one or the other food is richer. The "coverage" charts below show how much of the daily needs can be covered by 300 grams of the food.
| Contains more Vitamin CVitamin C | +∞% |
| Contains more Vitamin AVitamin A | +∞% |
| Contains more Vitamin EVitamin E | +∞% |
| Contains more Vitamin B1Vitamin B1 | +137.5% |
| Contains more Vitamin B2Vitamin B2 | +635.7% |
| Contains more Vitamin B3Vitamin B3 | +27197.2% |
| Contains more Vitamin B6Vitamin B6 | +6671.9% |
| Contains more Vitamin B12Vitamin B12 | +∞% |
All nutrients comparison - raw data values
| Nutrient |  |
 |
DV% diff. |
| Vitamin B6 | 0.032mg | 2.167mg | 164% |
| Vitamin B12 | 0µg | 1.97µg | 82% |
| Vitamin B3 | 0.036mg | 9.827mg | 61% |
| Vitamin B5 | 1.54mg | 31% | |
| Vitamin C | 25.4mg | 0mg | 28% |
| Vitamin B2 | 0.014mg | 0.103mg | 7% |
| Caffeine | 0mg | 29mg | 7% |
| Vitamin B1 | 0.095mg | 0.04mg | 5% |
| Potassium | 122mg | 3mg | 4% |
| Magnesium | 5mg | 19mg | 3% |
| Iron | 0.25mg | 0.06mg | 2% |
| Fructose | 1.63g | 2% | |
| Calories | 54kcal | 43kcal | 1% |
| Protein | 0.13g | 0.46g | 1% |
| Carbs | 13.16g | 10.23g | 1% |
| Copper | 0.013mg | 0.002mg | 1% |
| Phosphorus | 7mg | 0mg | 1% |
| Sodium | 61mg | 39mg | 1% |
| Vitamin A | 5µg | 0µg | 1% |
| Protein per 100 calories | 0.24g | 1.1g | N/A |
| Calories per 10 g protein | 4154kcal | 935kcal | N/A |
| Weight per 100 calories | 185g | 233g | N/A |
| Net carbs | 13.06g | 10.23g | N/A |
| Calcium | 3mg | 6mg | 0% |
| Sugar | 12.11g | 10.22g | N/A |
| Fiber | 0.1g | 0g | 0% |
| Zinc | 0.04mg | 0.01mg | 0% |
| Vitamin E | 0.05mg | 0mg | 0% |
| Manganese | 0.005mg | 0% | |
| Selenium | 0.1µg | 0.2µg | 0% |
| Choline | 1.8mg | 0.3mg | 0% |
Macronutrient Comparison
Macronutrient breakdown side-by-side comparison
Protein:
0.13 g
Fats:
0 g
Carbs:
13.16 g
Water:
86.39 g
Other:
0.32 g
Protein:
0.46 g
Fats:
0 g
Carbs:
10.23 g
Water:
89.22 g
Other:
0.09 g
| Contains more CarbsCarbs | +28.6% |
| Contains more OtherOther | +255.6% |
| Contains more ProteinProtein | +253.8% |
~equal in
Fats
~0g
~equal in
Water
~89.22g