
Beverages, Meal supplement drink, canned, peanut flavor vs. Coca-Cola — In-Depth Nutrition Comparison
Compare
Important differences between beverages, Meal supplement drink, canned, peanut flavor and Coca-Cola
- Beverages, Meal supplement drink, canned, peanut flavor has more vitamin B2, vitamin B6, vitamin B3, vitamin B1, vitamin B5, iron, vitamin B12, phosphorus, calcium, and protein than Coca-Cola.
- Beverages, Meal supplement drink, canned, peanut flavor's daily need coverage for vitamin B2 is 100% more.
The food varieties used in the comparison are Beverages, Meal supplement drink, canned, peanut flavor and Beverages, carbonated, cola, fast-food cola.
Infographic
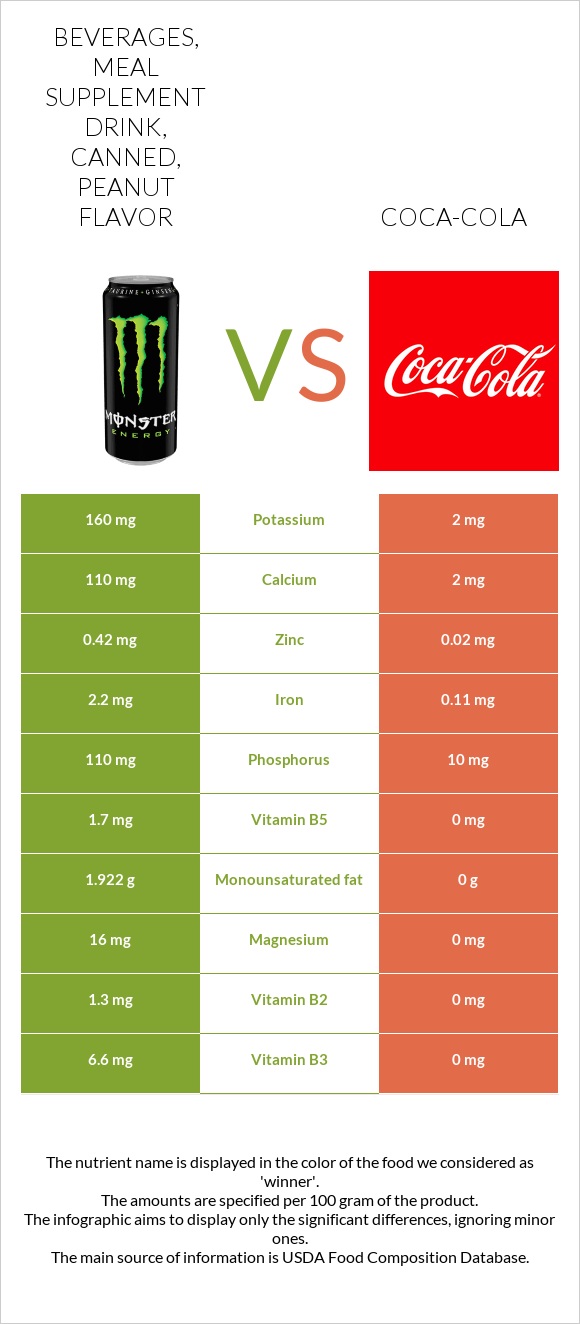
Infographic link
Mineral Comparison
The mineral comparison score is based on which food has a more favorable amount of each mineral. The �coverage� charts below show how much of the daily mineral needs are covered by the selected amount of each food.
| Contains more MagnesiumMagnesium | +∞% |
| Contains more CalciumCalcium | +5400% |
| Contains more PotassiumPotassium | +7900% |
| Contains more IronIron | +1900% |
| Contains more CopperCopper | +2900% |
| Contains more ZincZinc | +2000% |
| Contains more PhosphorusPhosphorus | +1000% |
| Contains more ManganeseManganese | +3450% |
| Contains less SodiumSodium | -92.6% |
| Contains more SeleniumSelenium | +∞% |
Vitamin Comparison
The vitamin comparison score is based on the number of vitamins in which one food is richer than the other. The �coverage� charts below show how much of the daily vitamin needs are covered by the selected amount of each food.
| Contains more Vitamin CVitamin C | +∞% |
| Contains more Vitamin EVitamin E | +∞% |
| Contains more Vitamin B1Vitamin B1 | +∞% |
| Contains more Vitamin B2Vitamin B2 | +∞% |
| Contains more Vitamin B3Vitamin B3 | +∞% |
| Contains more Vitamin B5Vitamin B5 | +∞% |
| Contains more Vitamin B6Vitamin B6 | +∞% |
| Contains more Vitamin B12Vitamin B12 | +∞% |
All nutrients comparison - raw data values
| Nutrient |  |
 |
DV% diff. |
| Vitamin B2 | 1.3mg | 0mg | 100% |
| Vitamin B6 | 0.54mg | 0mg | 42% |
| Vitamin B3 | 6.6mg | 0mg | 41% |
| Vitamin B1 | 0.43mg | 0mg | 36% |
| Vitamin B5 | 1.7mg | 0mg | 34% |
| Iron | 2.2mg | 0.11mg | 26% |
| Vitamin B12 | 0.53µg | 0µg | 22% |
| Phosphorus | 110mg | 10mg | 14% |
| Calcium | 110mg | 2mg | 11% |
| Protein | 3.5g | 0.07g | 7% |
| Fats | 3.07g | 0.02g | 5% |
| Potassium | 160mg | 2mg | 5% |
| Monounsaturated fat | 1.922g | 0g | 5% |
| Magnesium | 16mg | 0mg | 4% |
| Zinc | 0.42mg | 0.02mg | 4% |
| Calories | 101kcal | 37kcal | 3% |
| Copper | 0.03mg | 0.001mg | 3% |
| Manganese | 0.071mg | 0.002mg | 3% |
| Saturated fat | 0.571g | 0g | 3% |
| Carbs | 14.74g | 9.56g | 2% |
| Sodium | 54mg | 4mg | 2% |
| Caffeine | 8mg | 2% | |
| Vitamin C | 0.7mg | 0mg | 1% |
| Starch | 1.4g | 1% | |
| Vitamin E | 0.09mg | 0mg | 1% |
| Polyunsaturated fat | 0.178g | 0g | 1% |
| Omega-6 (Linoleic acid) | 0.13g | 1% | |
| Protein per 100 calories | 3.5g | 0.19g | N/A |
| Calories per 10 g protein | 289kcal | 5286kcal | N/A |
| Weight per 100 calories | 99g | 270g | N/A |
| Unsaturated / Saturated Fat ratio | 3.7 | N/A | |
| Net carbs | 14.74g | 9.56g | N/A |
| Sugar | 8.97g | N/A | |
| Selenium | 0.1µg | 0% | |
| Trans fat | 0.411g | 0g | N/A |
| Choline | 0.3mg | 0% | |
| Tryptophan | 0.04mg | 0% | |
| Threonine | 0.11mg | 0% | |
| Isoleucine | 0.145mg | 0% | |
| Leucine | 0.335mg | 0% | |
| Lysine | 0.225mg | 0% | |
| Methionine | 0.1mg | 0% | |
| Phenylalanine | 0.18mg | 0% | |
| Valine | 0.195mg | 0% | |
| Histidine | 0.06mg | 0% | |
| Omega-3 (ALA) | 0.005g | 0% |
Macronutrient Comparison
Macronutrient breakdown side-by-side comparison
Protein:
3.5 g
Fats:
3.07 g
Carbs:
14.74 g
Water:
77.79 g
Other:
0.9 g
Protein:
0.07 g
Fats:
0.02 g
Carbs:
9.56 g
Water:
90.31 g
Other:
0.04 g
| Contains more ProteinProtein | +4900% |
| Contains more FatsFats | +15250% |
| Contains more CarbsCarbs | +54.2% |
| Contains more WaterWater | +16.1% |