
Beverages, tea, green, ready-to-drink, sweetened vs. Lemon tea — In-Depth Nutrition Comparison
Compare
Summary of differences between beverages, tea, green, ready-to-drink, sweetened and lemon tea
These are the specific foods used in this comparison Beverages, tea, green, ready-to-drink, sweetened and Beverages, tea, ready-to-drink, lemon, diet.
Infographic
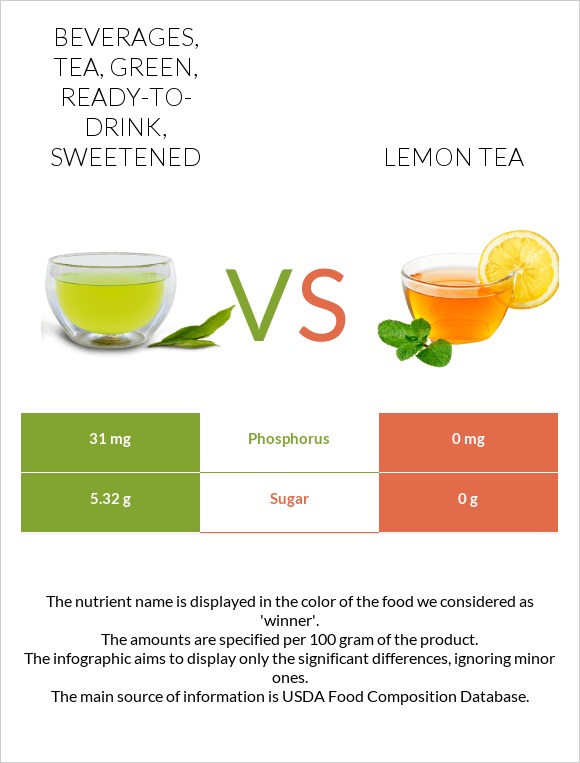
Infographic link
Mineral Comparison
The mineral comparison score is based on which food has a more favorable amount of each mineral. The �coverage� charts below show how much of the daily mineral needs are covered by the selected amount of each food.
| Contains more CalciumCalcium | +∞% |
| Contains more PhosphorusPhosphorus | +∞% |
| Contains more PotassiumPotassium | +208.3% |
| Contains less SodiumSodium | -95.2% |
| Contains more ManganeseManganese | +16.4% |
Vitamin Comparison
The vitamin comparison score is based on the number of vitamins in which one food is richer than the other. The �coverage� charts below show how much of the daily vitamin needs are covered by the selected amount of each food.
All nutrients comparison - raw data values
| Nutrient |  |
 |
DV% diff. |
| Phosphorus | 31mg | 0mg | 4% |
| Fructose | 3.12g | 0g | 4% |
| Carbs | 6.2g | 0.41g | 2% |
| Calories | 27kcal | 2kcal | 1% |
| Potassium | 12mg | 37mg | 1% |
| Sodium | 21mg | 1mg | 1% |
| Manganese | 0.073mg | 0.085mg | 1% |
| Caffeine | 5mg | 8mg | 1% |
| Weight per 100 calories | 370g | 5000g | N/A |
| Fats | 0.22g | 0g | 0% |
| Net carbs | 6.2g | 0.41g | N/A |
| Calcium | 1mg | 0mg | 0% |
| Sugar | 5.32g | 0g | N/A |
| Copper | 0.005mg | 0.005mg | 0% |
| Zinc | 0.01mg | 0.01mg | 0% |
Macronutrient Comparison
Macronutrient breakdown side-by-side comparison
Protein:
0 g
Fats:
0.22 g
Carbs:
6.2 g
Water:
93.54 g
Other:
0.04 g
Protein:
0 g
Fats:
0 g
Carbs:
0.41 g
Water:
99.55 g
Other:
0.04 g
| Contains more FatsFats | +∞% |
| Contains more CarbsCarbs | +1412.2% |
~equal in
Protein
~0g
~equal in
Water
~99.55g