Beverages, Vegetable and fruit juice drink, reduced calorie, with low-calorie sweetener, added vitamin C vs. Minute maid lemonade — In-Depth Nutrition Comparison
Compare
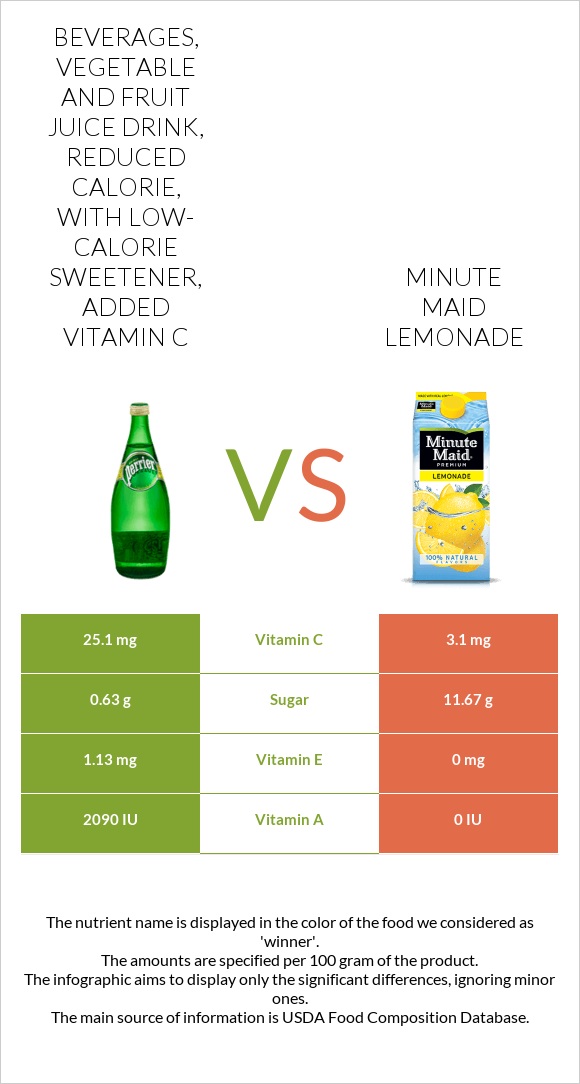
Important differences between beverages, Vegetable and fruit juice drink, reduced calorie, with low-calorie sweetener, added vitamin C and minute maid lemonade
- Minute maid lemonade has less vitamin A, vitamin C, and vitamin E.
- Beverages, Vegetable, and fruit juice drink, reduced calorie, with low-calorie sweetener, added vitamin C's daily need coverage for vitamin A is 42% more.
- Beverages, Vegetable, and fruit juice drink, reduced calorie, with low-calorie sweetener, added vitamin C is lower in sugar.
The food varieties used in the comparison are Beverages, Vegetable, and fruit juice drink, reduced calorie, with low-calorie sweetener, added vitamin C and Beverages, The COCA-COLA company, Minute Maid, Lemonade.
Infographic
Infographic link
Mineral Comparison
Mineral comparison score is based on the number of minerals by which one or the other food is richer. The "coverage" charts below show how much of the daily needs can be covered by 300 grams of the food.
| Contains more CalciumCalcium | +300% |
| Contains more PotassiumPotassium | +140% |
| Contains more IronIron | +∞% |
| Contains more ManganeseManganese | +∞% |
| Contains more MagnesiumMagnesium | +100% |
| Contains more CopperCopper | +33.3% |
| Contains less SodiumSodium | -57.1% |
| Contains more SeleniumSelenium | +∞% |
Vitamin Comparison
Vitamin comparison score is based on the number of vitamins by which one or the other food is richer. The "coverage" charts below show how much of the daily needs can be covered by 300 grams of the food.
| Contains more Vitamin CVitamin C | +709.7% |
| Contains more Vitamin AVitamin A | +∞% |
| Contains more Vitamin EVitamin E | +∞% |
| Contains more Vitamin B3Vitamin B3 | +44.4% |
| Contains more Vitamin B5Vitamin B5 | +∞% |
| Contains more Vitamin KVitamin K | +∞% |
| Contains more Vitamin B1Vitamin B1 | +100% |
| Contains more Vitamin B2Vitamin B2 | +200% |
| Contains more FolateFolate | +∞% |
All nutrients comparison - raw data values
| Nutrient |  |
 |
DV% diff. |
| Vitamin C | 25.1mg | 3.1mg | 24% |
| Vitamin A | 105µg | 0µg | 12% |
| Vitamin E | 1.13mg | 0mg | 8% |
| Carbs | 1.1g | 12.08g | 4% |
| Iron | 0.3mg | 0mg | 4% |
| Calories | 4kcal | 46kcal | 2% |
| Calcium | 8mg | 2mg | 1% |
| Weight per 100 calories | 2500g | 217g | N/A |
| Net carbs | 1.1g | 12.08g | N/A |
| Magnesium | 1mg | 2mg | 0% |
| Potassium | 24mg | 10mg | 0% |
| Sugar | 0.63g | 11.67g | N/A |
| Copper | 0.012mg | 0.016mg | 0% |
| Zinc | 0.01mg | 0.01mg | 0% |
| Phosphorus | 1mg | 1mg | 0% |
| Sodium | 14mg | 6mg | 0% |
| Manganese | 0.005mg | 0% | |
| Selenium | 0µg | 0.1µg | 0% |
| Vitamin B1 | 0.001mg | 0.002mg | 0% |
| Vitamin B2 | 0.001mg | 0.003mg | 0% |
| Vitamin B3 | 0.013mg | 0.009mg | 0% |
| Vitamin B5 | 0.007mg | 0% | |
| Vitamin B6 | 0.004mg | 0.004mg | 0% |
| Vitamin K | 0.1µg | 0µg | 0% |
| Folate | 0µg | 1µg | 0% |
| Choline | 0.2mg | 0.5mg | 0% |
Macronutrient Comparison
Macronutrient breakdown side-by-side comparison
Protein:
0 g
Fats:
0 g
Carbs:
1.1 g
Water:
98.78 g
Other:
0.12 g
Protein:
0 g
Fats:
0 g
Carbs:
12.08 g
Water:
87.9 g
Other:
0.02 g
| Contains more WaterWater | +12.4% |
| Contains more OtherOther | +500% |
| Contains more CarbsCarbs | +998.2% |
~equal in
Protein
~0g
~equal in
Fats
~0g