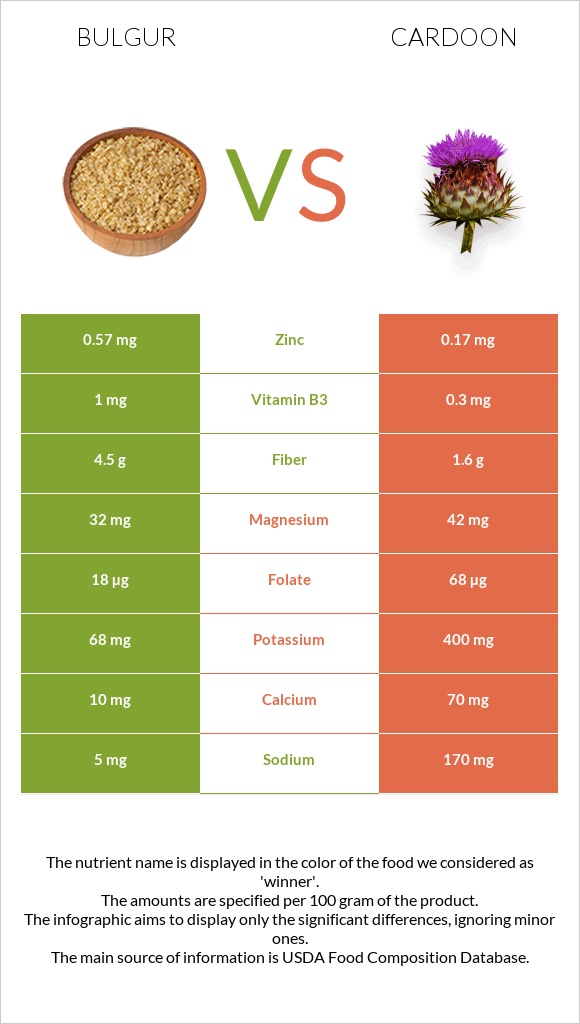
A recap on the differences between bulgur and cardoon Bulgur has more manganese and fiber; however, cardoon is higher in copper, folate, potassium, and calcium. Cardoon covers your daily copper needs 17% more than bulgur. Cardoon contains 3 times less zinc than bulgur. Bulgur contains 0.57mg of zinc, while cardoon contains 0.17mg. Bulgur has less sodium. Food varieties used in this article are Bulgur, cooked and Cardoon, raw .
Infographic
Mineral Comparison
Mineral comparison score is based on the number of minerals by which one or the other food is richer. The "coverage" charts below show how much of the daily needs can be covered by 300 grams of the food.
6
100 g
300 g
1 tbsp - 8.4g 1 cup - 182g
Magnesium
Magnesium
Calcium
Calcium
Potassium
Potassium
Iron
Iron
Copper
Copper
Zinc
Zinc
Phosphorus
Phosphorus
Sodium
Sodium
Manganese
Manganese
Selenium
Selenium
23%
3%
6%
36%
25%
16%
17%
0.65%
79%
3.3%
4
100 g
300 g
1 cup, shredded - 178g
Magnesium
Magnesium
Calcium
Calcium
Potassium
Potassium
Iron
Iron
Copper
Copper
Zinc
Zinc
Phosphorus
Phosphorus
Sodium
Sodium
Manganese
Manganese
Selenium
Selenium
30%
21%
35%
26%
77%
4.6%
9.9%
22%
33%
1.1%
Vitamin Comparison
Vitamin comparison score is based on the number of vitamins by which one or the other food is richer. The "coverage" charts below show how much of the daily needs can be covered by 300 grams of the food.
4
100 g
300 g
1 tbsp - 8.4g 1 cup - 182g
Vitamin C
Vit. C
Vitamin D
Vit. D
Vitamin A
Vit. A
Vitamin E
Vit. E
Vitamin B1
Vit. B1
Vitamin B2
Vit. B2
Vitamin B3
Vit. B3
Vitamin B5
Vit. B5
Vitamin B6
Vit. B6
Vitamin B12
Vit. B12
Vitamin K
Vit. K
Folate
Folate
0%
0%
0%
0.2%
14%
6.5%
19%
21%
19%
0%
1.3%
14%
3
100 g
300 g
1 cup, shredded - 178g
Vitamin C
Vit. C
Vitamin D
Vit. D
Vitamin A
Vit. A
Vitamin E
Vit. E
Vitamin B1
Vit. B1
Vitamin B2
Vit. B2
Vitamin B3
Vit. B3
Vitamin B5
Vit. B5
Vitamin B6
Vit. B6
Vitamin B12
Vit. B12
Vitamin K
Vit. K
Folate
Folate
6.7%
0%
0%
0%
5%
6.9%
5.6%
20%
27%
0%
0%
51%
All nutrients comparison - raw data values
Nutrient
DV% diff.
Copper
0.075mg
0.231mg
17%
Manganese
0.609mg
0.256mg
15%
Folate
18µg
68µg
13%
Fiber
4.5g
1.6g
12%
Potassium
68mg
400mg
10%
Sodium
5mg
170mg
7%
Calcium
10mg
70mg
6%
Protein
3.08g
0.7g
5%
Carbs
18.58g
4.07g
5%
Zinc
0.57mg
0.17mg
4%
Vitamin B3
1mg
0.3mg
4%
Calories
83kcal
17kcal
3%
Iron
0.96mg
0.7mg
3%
Vitamin B1
0.057mg
0.02mg
3%
Vitamin B6
0.083mg
0.116mg
3%
Vitamin C
0mg
2mg
2%
Magnesium
32mg
42mg
2%
Phosphorus
40mg
23mg
2%
Selenium
0.6µg
0.2µg
1%
Choline
6.9mg
1%
Protein per 100 calories
3.7g
4.1g
N/A
Calories per 10 g protein
269kcal
243kcal
N/A
Weight per 100 calories
120g
588g
N/A
Fats
0.24g
0.1g
0%
Net carbs
14.08g
2.47g
N/A
Sugar
0.1g
N/A
Vitamin E
0.01mg
0%
Vitamin B2
0.028mg
0.03mg
0%
Vitamin B5
0.344mg
0.338mg
0%
Vitamin K
0.5µg
0%
Saturated fat
0.042g
0.011g
0%
Monounsaturated fat
0.031g
0.018g
0%
Polyunsaturated fat
0.098g
0.041g
0%
Tryptophan
0.048mg
0%
Threonine
0.089mg
0%
Isoleucine
0.114mg
0%
Leucine
0.208mg
0%
Lysine
0.085mg
0%
Methionine
0.048mg
0%
Phenylalanine
0.145mg
0%
Valine
0.139mg
0%
Histidine
0.071mg
0%
Macronutrient Comparison
Macronutrient breakdown side-by-side comparison
3
3%
19%
78%
Protein:
3.08 g
Fats:
0.24 g
Carbs:
18.58 g
Water:
77.76 g
Other:
0.34 g
2
4%
94%
Protein:
0.7 g
Fats:
0.1 g
Carbs:
4.07 g
Water:
94 g
Other:
1.13 g
Contains
more
Protein Protein
+340%
Contains
more
Fats Fats
+140%
Contains
more
Carbs Carbs
+356.5%
Contains
more
Water Water
+20.9%
Contains
more
Other Other
+232.4%
Fat Type Comparison
Fat type breakdown side-by-side comparison
2
25%
18%
57%
Saturated fat:
Sat. Fat
0.042 g
Monounsaturated fat:
Mono. Fat
0.031 g
Polyunsaturated fat:
Poly. Fat
0.098 g
1
16%
26%
59%
Saturated fat:
Sat. Fat
0.011 g
Monounsaturated fat:
Mono. Fat
0.018 g
Polyunsaturated fat:
Poly. Fat
0.041 g
Contains
more
Mono. Fat Monounsaturated fat
+72.2%
Contains
more
Poly. Fat Polyunsaturated fat
+139%
Contains
less
Sat. Fat Saturated fat
-73.8%