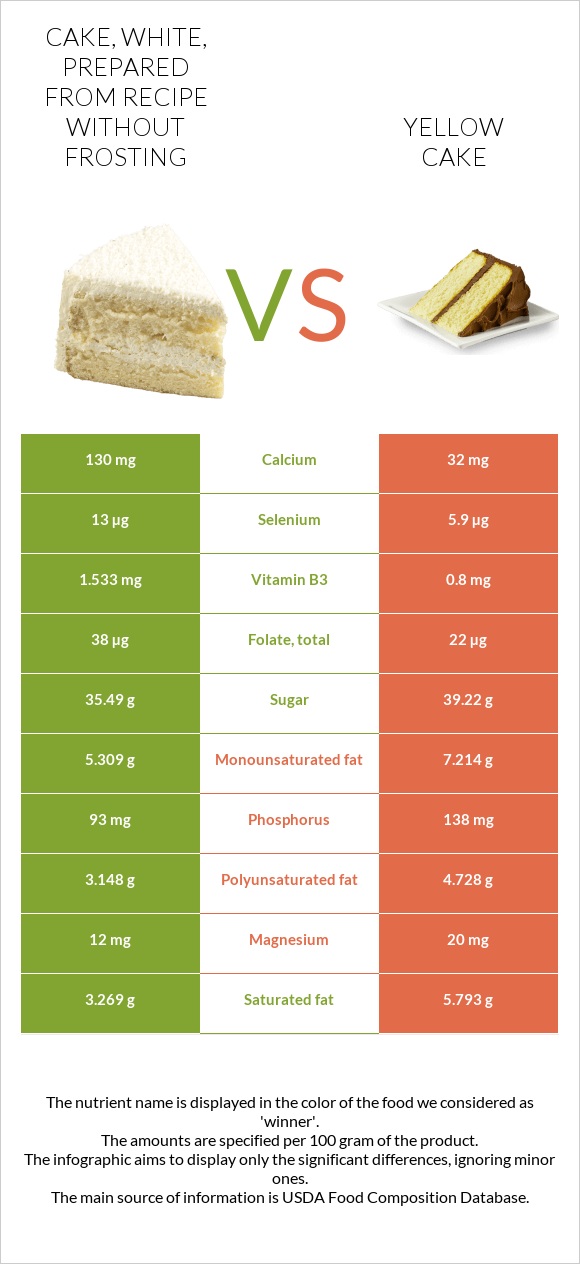
Cake, white, prepared from recipe without frosting vs. Yellow cake — In-Depth Nutrition Comparison
Compare
How are cake, white, prepared from recipe without frosting and yellow cake different?
- Cake, white, prepared from recipe without frosting is higher in selenium, vitamin B1, vitamin B2, and calcium; however, yellow cake is richer in vitamin E, vitamin K, copper, phosphorus, and iron.
- Daily need coverage for vitamin E for yellow cake is 29% higher.
- Cake, white, prepared from recipe without frosting contains 4 times more vitamin B1 than yellow cake. While cake, white, prepared from recipe without frosting contains 0.186mg of vitamin B1, yellow cake contains only 0.043mg.
- Cake, white, prepared from recipe without frosting has less saturated fat.
Cake, white, prepared from recipe without frosting and Cake, yellow, commercially prepared, with chocolate frosting, in-store bakery are the varieties used in this article.
Infographic
Infographic link
Mineral Comparison
Mineral comparison score is based on the number of minerals by which one or the other food is richer. The "coverage" charts below show how much of the daily needs can be covered by 300 grams of the food.
| Contains more CalciumCalcium | +306.3% |
| Contains more SeleniumSelenium | +120.3% |
| Contains more MagnesiumMagnesium | +66.7% |
| Contains more PotassiumPotassium | +96.8% |
| Contains more IronIron | +33.6% |
| Contains more CopperCopper | +169.5% |
| Contains more ZincZinc | +31.3% |
| Contains more PhosphorusPhosphorus | +48.4% |
| Contains more ManganeseManganese | +12.7% |
Vitamin Comparison
Vitamin comparison score is based on the number of vitamins by which one or the other food is richer. The "coverage" charts below show how much of the daily needs can be covered by 300 grams of the food.
| Contains more Vitamin CVitamin C | +∞% |
| Contains more Vitamin AVitamin A | +114.3% |
| Contains more Vitamin B1Vitamin B1 | +332.6% |
| Contains more Vitamin B2Vitamin B2 | +160.2% |
| Contains more Vitamin B3Vitamin B3 | +91.6% |
| Contains more Vitamin B5Vitamin B5 | +11.5% |
| Contains more Vitamin B6Vitamin B6 | +∞% |
| Contains more Vitamin B12Vitamin B12 | +∞% |
| Contains more FolateFolate | +72.7% |
| Contains more Vitamin EVitamin E | +3650% |
| Contains more Vitamin KVitamin K | +392.2% |
All nutrients comparison - raw data values
| Nutrient |  |
 |
DV% diff. |
| Vitamin E | 0.12mg | 4.5mg | 29% |
| Vitamin K | 5.1µg | 25.1µg | 17% |
| Selenium | 13µg | 5.9µg | 13% |
| Vitamin B1 | 0.186mg | 0.043mg | 12% |
| Copper | 0.059mg | 0.159mg | 11% |
| Vitamin B2 | 0.242mg | 0.093mg | 11% |
| Saturated fat | 3.269g | 5.793g | 11% |
| Polyunsaturated fat | 3.148g | 4.728g | 11% |
| Calcium | 130mg | 32mg | 10% |
| Fats | 12.4g | 17.75g | 8% |
| Iron | 1.52mg | 2.03mg | 6% |
| Phosphorus | 93mg | 138mg | 6% |
| Cholesterol | 2mg | 16mg | 5% |
| Vitamin B3 | 1.533mg | 0.8mg | 5% |
| Monounsaturated fat | 5.309g | 7.214g | 5% |
| Protein | 5.4g | 3.16g | 4% |
| Starch | 8.55g | 4% | |
| Folate | 38µg | 22µg | 4% |
| Potassium | 95mg | 187mg | 3% |
| Fiber | 0.8g | 1.5g | 3% |
| Vitamin B12 | 0.08µg | 0µg | 3% |
| Magnesium | 12mg | 20mg | 2% |
| Vitamin B6 | 0.021mg | 0mg | 2% |
| Choline | 5.7mg | 17.4mg | 2% |
| Calories | 357kcal | 379kcal | 1% |
| Carbs | 57.2g | 55.36g | 1% |
| Vitamin D* | 6 IU | 1% | |
| Vitamin D | 0.2µg | 1% | |
| Zinc | 0.32mg | 0.42mg | 1% |
| Sodium | 327mg | 310mg | 1% |
| Vitamin A | 15µg | 7µg | 1% |
| Manganese | 0.197mg | 0.222mg | 1% |
| Fructose | 0.62g | 1% | |
| Protein per 100 calories | 1.5g | 0.83g | N/A |
| Calories per 10 g protein | 661kcal | 1199kcal | N/A |
| Weight per 100 calories | 28g | 26g | N/A |
| Unsaturated / Saturated Fat ratio | 2.6 | 2.1 | N/A |
| Vitamin C | 0.2mg | 0mg | 0% |
| Net carbs | 56.4g | 53.86g | N/A |
| Sugar | 35.49g | 39.22g | N/A |
| Vitamin B5 | 0.184mg | 0.165mg | 0% |
| Trans fat | 1.313g | N/A | |
| Tryptophan | 0.067mg | 0% | |
| Threonine | 0.19mg | 0% | |
| Isoleucine | 0.243mg | 0% | |
| Leucine | 0.419mg | 0% | |
| Lysine | 0.241mg | 0% | |
| Methionine | 0.128mg | 0% | |
| Phenylalanine | 0.281mg | 0% | |
| Valine | 0.276mg | 0% | |
| Histidine | 0.124mg | 0% | |
| Omega-3 - ALA | 0.474g | N/A | |
| Omega-6 - Gamma-linoleic acid | 0.026g | N/A | |
| Omega-6 - Dihomo-gamma-linoleic acid | 0.001g | N/A | |
| Omega-6 - Eicosadienoic acid | 0.004g | N/A | |
| Omega-6 - Linoleic acid | 3.999g | N/A |
Macronutrient Comparison
Macronutrient breakdown side-by-side comparison
Protein:
5.4 g
Fats:
12.4 g
Carbs:
57.2 g
Water:
23.3 g
Other:
1.7 g
Protein:
3.16 g
Fats:
17.75 g
Carbs:
55.36 g
Water:
22.38 g
Other:
1.35 g
| Contains more ProteinProtein | +70.9% |
| Contains more OtherOther | +25.9% |
| Contains more FatsFats | +43.1% |
~equal in
Carbs
~55.36g
~equal in
Water
~22.38g
Fat Type Comparison
Fat type breakdown side-by-side comparison
Saturated fat:
Sat. Fat
3.269 g
Monounsaturated fat:
Mono. Fat
5.309 g
Polyunsaturated fat:
Poly. Fat
3.148 g
Saturated fat:
Sat. Fat
5.793 g
Monounsaturated fat:
Mono. Fat
7.214 g
Polyunsaturated fat:
Poly. Fat
4.728 g
| Contains less Sat. FatSaturated fat | -43.6% |
| Contains more Mono. FatMonounsaturated fat | +35.9% |
| Contains more Poly. FatPolyunsaturated fat | +50.2% |