Candies, MARS SNACKFOOD US, COCOAVIA Crispy Chocolate Bar vs. After eight — In-Depth Nutrition Comparison
Compare
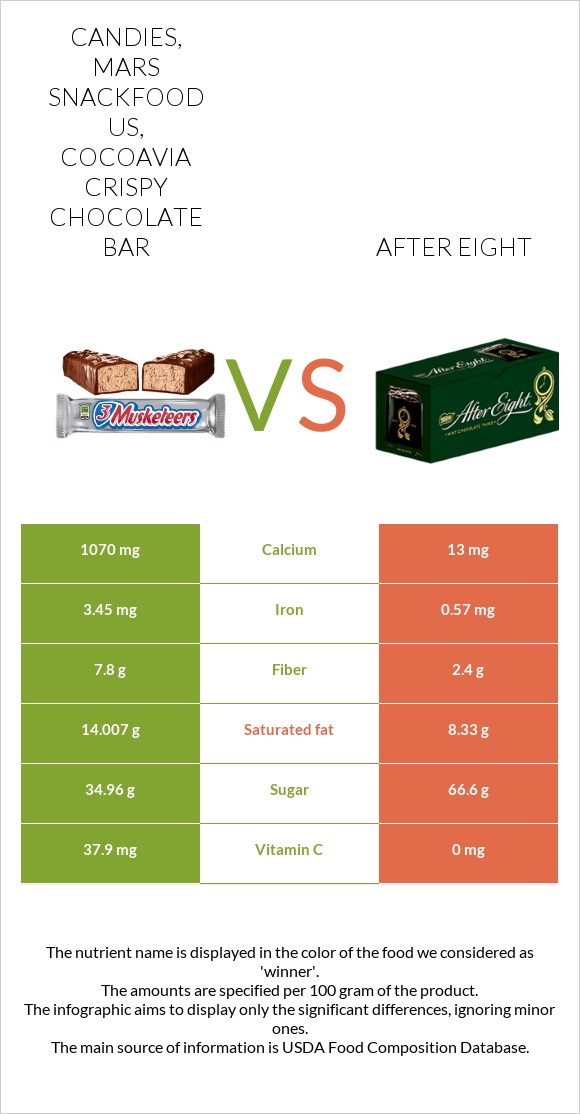
Differences between candies, MARS SNACKFOOD US, COCOAVIA Crispy Chocolate Bar and after eight
- After eight contains less calcium, vitamin C, iron, and fiber than candies, MARS SNACKFOOD US, COCOAVIA Crispy Chocolate Bar.
- Candies, MARS SNACKFOOD US, COCOAVIA Crispy Chocolate Bar's daily need coverage for calcium is 106% higher.
- The amount of saturated fat in after eight is lower.
The food types used in this comparison are Candies, MARS SNACKFOOD US, COCOAVIA Crispy Chocolate Bar and Candies, NESTLE, AFTER EIGHT Mints.
Infographic
Infographic link
Mineral Comparison
Mineral comparison score is based on the number of minerals by which one or the other food is richer. The "coverage" charts below show how much of the daily needs can be covered by 300 grams of the food.
| Contains more CalciumCalcium | +8130.8% |
| Contains more IronIron | +505.3% |
| Contains less SodiumSodium | -97.5% |
Vitamin Comparison
Vitamin comparison score is based on the number of vitamins by which one or the other food is richer. The "coverage" charts below show how much of the daily needs can be covered by 300 grams of the food.
| Contains more Vitamin CVitamin C | +∞% |
| Contains more Vitamin EVitamin E | +∞% |
| Contains more Vitamin B6Vitamin B6 | +∞% |
| Contains more Vitamin B12Vitamin B12 | +∞% |
| Contains more FolateFolate | +∞% |
All nutrients comparison - raw data values
| Nutrient |  |
 |
DV% diff. |
| Vitamin B12 | 3µg | 125% | |
| Vitamin B6 | 1.5mg | 115% | |
| Calcium | 1070mg | 13mg | 106% |
| Vitamin E | 10.13mg | 68% | |
| Folate | 200µg | 50% | |
| Vitamin C | 37.9mg | 0mg | 42% |
| Iron | 3.45mg | 0.57mg | 36% |
| Saturated fat | 14.007g | 8.33g | 26% |
| Fats | 26.23g | 11.9g | 22% |
| Fiber | 7.8g | 2.4g | 22% |
| Protein | 8.21g | 1.67g | 13% |
| Carbs | 62.06g | 79.53g | 6% |
| Calories | 517kcal | 432kcal | 4% |
| Sodium | 40mg | 1mg | 2% |
| Protein per 100 calories | 1.6g | 0.39g | N/A |
| Calories per 10 g protein | 630kcal | 2587kcal | N/A |
| Weight per 100 calories | 19g | 23g | N/A |
| Net carbs | 54.26g | 77.13g | N/A |
| Sugar | 34.96g | 66.6g | N/A |
Macronutrient Comparison
Macronutrient breakdown side-by-side comparison
Protein:
8.21 g
Fats:
26.23 g
Carbs:
62.06 g
Water:
1.9 g
Other:
1.6 g
Protein:
1.67 g
Fats:
11.9 g
Carbs:
79.53 g
Water:
6.3 g
Other:
0.6 g
| Contains more ProteinProtein | +391.6% |
| Contains more FatsFats | +120.4% |
| Contains more OtherOther | +166.7% |
| Contains more CarbsCarbs | +28.2% |
| Contains more WaterWater | +231.6% |
Fat Type Comparison
Fat type breakdown side-by-side comparison
Saturated fat:
Sat. Fat
14.007 g
Monounsaturated fat:
Mono. Fat
0 g
Polyunsaturated fat:
Poly. Fat
0 g
Saturated fat:
Sat. Fat
8.33 g
Monounsaturated fat:
Mono. Fat
0 g
Polyunsaturated fat:
Poly. Fat
0 g
| Contains less Sat. FatSaturated fat | -40.5% |
~equal in
Monounsaturated fat
~g
~equal in
Polyunsaturated fat
~g