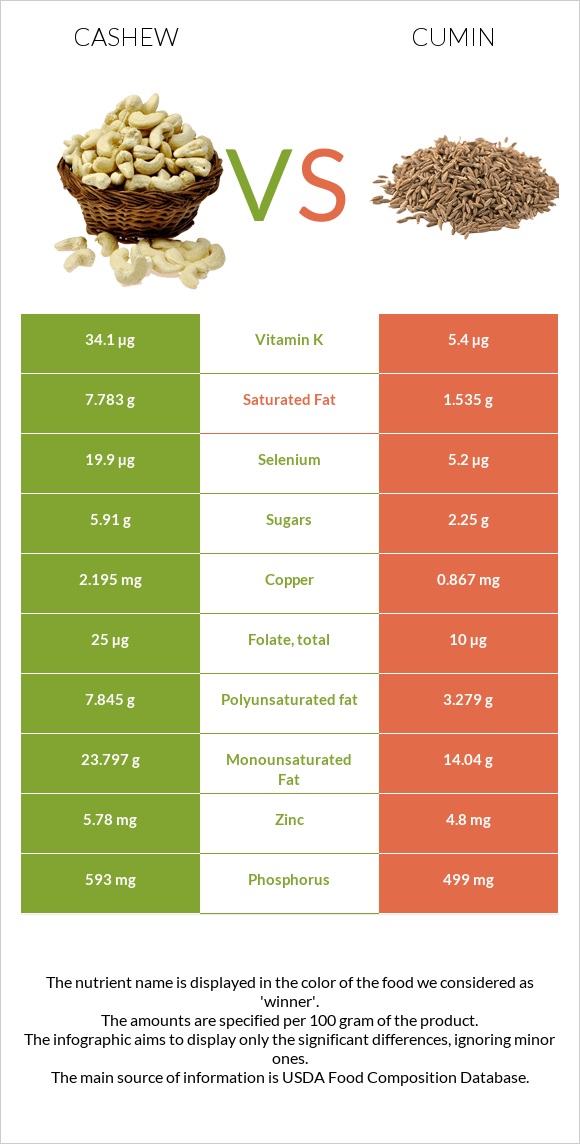
Differences between cashew and cumin Cashew has more copper, selenium, and vitamin K, while cumin has more iron, calcium, manganese, potassium, fiber, and vitamin A. Cumin's daily need coverage for iron is 746% higher. Cumin contains 6 times less vitamin K than cashew. Cashew contains 34.1µg of vitamin K, while cumin contains 5.4µg. The amount of saturated fat in cumin is lower. Cumin has a lower glycemic index. The glycemic index of cumin is 0, while the glycemic index of cashew is 25. The food types used in this comparison are Nuts, cashew nuts, raw and Spices, cumin seed .
Infographic
Mineral Comparison
Mineral comparison score is based on the number of minerals by which one or the other food is richer. The "coverage" charts below show how much of the daily needs can be covered by 300 grams of the food.
5
100 g
300 g
1 oz - 28.35g
Magnesium
Magnesium
Calcium
Calcium
Potassium
Potassium
Iron
Iron
Copper
Copper
Zinc
Zinc
Phosphorus
Phosphorus
Sodium
Sodium
Manganese
Manganese
Selenium
Selenium
209%
11%
58%
251%
732%
158%
254%
1.6%
216%
109%
5
100 g
300 g
0.25 tsp, whole - 0.5g 1 tbsp, whole - 6g
Magnesium
Magnesium
Calcium
Calcium
Potassium
Potassium
Iron
Iron
Copper
Copper
Zinc
Zinc
Phosphorus
Phosphorus
Sodium
Sodium
Manganese
Manganese
Selenium
Selenium
261%
279%
158%
2489%
289%
131%
214%
22%
435%
28%
Vitamin Comparison
Vitamin comparison score is based on the number of vitamins by which one or the other food is richer. The "coverage" charts below show how much of the daily needs can be covered by 300 grams of the food.
3
100 g
300 g
1 oz - 28.35g
Vitamin C
Vit. C
Vitamin D
Vit. D
Vitamin A
Vit. A
Vitamin E
Vit. E
Vitamin B1
Vit. B1
Vitamin B2
Vit. B2
Vitamin B3
Vit. B3
Vitamin B5
Vit. B5
Vitamin B6
Vit. B6
Vitamin B12
Vit. B12
Vitamin K
Vit. K
Folate
Folate
1.7%
0%
0%
18%
106%
13%
20%
52%
96%
0%
85%
19%
6
100 g
300 g
0.25 tsp, whole - 0.5g 1 tbsp, whole - 6g
Vitamin C
Vit. C
Vitamin D
Vit. D
Vitamin A
Vit. A
Vitamin E
Vit. E
Vitamin B1
Vit. B1
Vitamin B2
Vit. B2
Vitamin B3
Vit. B3
Vitamin B5
Vit. B5
Vitamin B6
Vit. B6
Vitamin B12
Vit. B12
Vitamin K
Vit. K
Folate
Folate
26%
0%
21%
67%
157%
75%
86%
0%
100%
0%
14%
7.5%
All nutrients comparison - raw data values
Nutrient
DV% diff.
Iron
6.68mg
66.36mg
746%
Copper
2.195mg
0.867mg
148%
Calcium
37mg
931mg
89%
Manganese
1.655mg
3.333mg
73%
Fats
43.85g
22.27g
33%
Potassium
660mg
1788mg
33%
Polyunsaturated fat
7.845g
3.279g
30%
Fiber
3.3g
10.5g
29%
Saturated fat
7.783g
1.535g
28%
Selenium
19.9µg
5.2µg
27%
Vitamin K
34.1µg
5.4µg
24%
Monounsaturated fat
23.797g
14.04g
24%
Vitamin B3
1.062mg
4.579mg
22%
Vitamin B2
0.058mg
0.327mg
21%
Magnesium
292mg
366mg
18%
Vitamin B1
0.423mg
0.628mg
17%
Vitamin B5
0.864mg
17%
Vitamin E
0.9mg
3.33mg
16%
Phosphorus
593mg
499mg
13%
Starch
23.49g
10%
Calories
553kcal
375kcal
9%
Zinc
5.78mg
4.8mg
9%
Vitamin C
0.5mg
7.7mg
8%
Sodium
12mg
168mg
7%
Vitamin A
0µg
64µg
7%
Carbs
30.19g
44.24g
5%
Folate
25µg
10µg
4%
Choline
24.7mg
4%
Protein
18.22g
17.81g
1%
Vitamin B6
0.417mg
0.435mg
1%
Protein per 100 calories
3.3g
4.7g
N/A
Calories per 10 g protein
304kcal
211kcal
N/A
Weight per 100 calories
18g
27g
N/A
Unsaturated / Saturated Fat ratio
4.1
11
N/A
Net carbs
26.89g
33.74g
N/A
Sugar
5.91g
2.25g
N/A
Tryptophan
0.287mg
0%
Threonine
0.688mg
0%
Isoleucine
0.789mg
0%
Leucine
1.472mg
0%
Lysine
0.928mg
0%
Methionine
0.362mg
0%
Phenylalanine
0.951mg
0%
Valine
1.094mg
0%
Histidine
0.456mg
0%
Fructose
0.05g
0%
Macronutrient Comparison
Macronutrient breakdown side-by-side comparison
2
18%
44%
30%
5%
3%
Protein:
18.22 g
Fats:
43.85 g
Carbs:
30.19 g
Water:
5.2 g
Other:
2.54 g
3
18%
22%
44%
8%
8%
Protein:
17.81 g
Fats:
22.27 g
Carbs:
44.24 g
Water:
8.06 g
Other:
7.62 g
Contains
more
Fats Fats
+96.9%
Contains
more
Carbs Carbs
+46.5%
Contains
more
Water Water
+55%
Contains
more
Other Other
+200%
~equal in
Protein
~17.81g
Fat Type Comparison
Fat type breakdown side-by-side comparison
2
20%
60%
20%
Saturated fat:
Sat. Fat
7.783 g
Monounsaturated fat:
Mono. Fat
23.797 g
Polyunsaturated fat:
Poly. Fat
7.845 g
1
8%
74%
17%
Saturated fat:
Sat. Fat
1.535 g
Monounsaturated fat:
Mono. Fat
14.04 g
Polyunsaturated fat:
Poly. Fat
3.279 g
Contains
more
Mono. Fat Monounsaturated fat
+69.5%
Contains
more
Poly. Fat Polyunsaturated fat
+139.2%
Contains
less
Sat. Fat Saturated fat
-80.3%