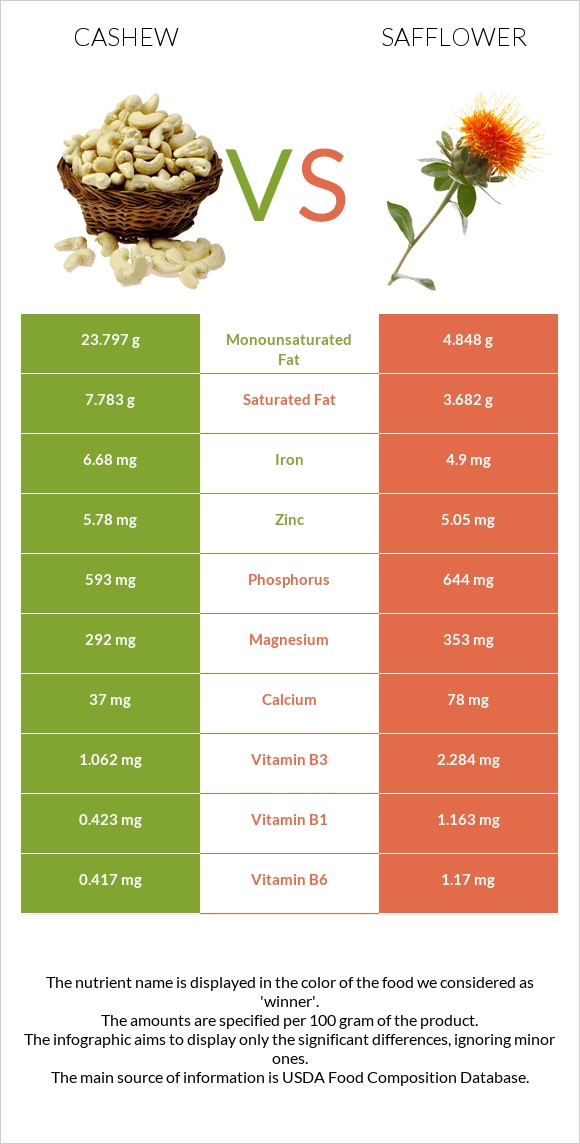
How are cashew and safflower different? Cashew is richer in copper and iron, while safflower is higher in vitamin B5, vitamin B1, vitamin B6, folate, vitamin B2, manganese, and magnesium. Safflower covers your daily need for vitamin B5, 63% more than cashew. Cashew contains 2 times more saturated fat than safflower. Cashew contains 7.783g of saturated fat, while safflower contains 3.682g. Nuts, cashew nuts, raw and Seeds, safflower seed kernels, dried types were used in this article.
Infographic
Mineral Comparison
Mineral comparison score is based on the number of minerals by which one or the other food is richer. The "coverage" charts below show how much of the daily needs can be covered by 300 grams of the food.
4
100 g
300 g
1 oz - 28.35g
Magnesium
Magnesium
Calcium
Calcium
Potassium
Potassium
Iron
Iron
Copper
Copper
Zinc
Zinc
Phosphorus
Phosphorus
Sodium
Sodium
Manganese
Manganese
Selenium
Selenium
209%
11%
58%
251%
732%
158%
254%
1.6%
216%
109%
4
100 g
300 g
1 oz - 28.35g
Magnesium
Magnesium
Calcium
Calcium
Potassium
Potassium
Iron
Iron
Copper
Copper
Zinc
Zinc
Phosphorus
Phosphorus
Sodium
Sodium
Manganese
Manganese
Selenium
Selenium
252%
23%
61%
184%
582%
138%
276%
0.39%
263%
0%
Vitamin Comparison
Vitamin comparison score is based on the number of vitamins by which one or the other food is richer. The "coverage" charts below show how much of the daily needs can be covered by 300 grams of the food.
3
100 g
300 g
1 oz - 28.35g
Vitamin C
Vit. C
Vitamin D
Vit. D
Vitamin A
Vit. A
Vitamin E
Vit. E
Vitamin B1
Vit. B1
Vitamin B2
Vit. B2
Vitamin B3
Vit. B3
Vitamin B5
Vit. B5
Vitamin B6
Vit. B6
Vitamin B12
Vit. B12
Vitamin K
Vit. K
Folate
Folate
1.7%
0%
0%
18%
106%
13%
20%
52%
96%
0%
85%
19%
7
100 g
300 g
1 oz - 28.35g
Vitamin C
Vit. C
Vitamin D
Vit. D
Vitamin A
Vit. A
Vitamin E
Vit. E
Vitamin B1
Vit. B1
Vitamin B2
Vit. B2
Vitamin B3
Vit. B3
Vitamin B5
Vit. B5
Vitamin B6
Vit. B6
Vitamin B12
Vit. B12
Vitamin K
Vit. K
Folate
Folate
0%
0%
1%
0%
291%
96%
43%
242%
270%
0%
0%
120%
All nutrients comparison - raw data values
Nutrient
DV% diff.
Polyunsaturated fat
7.845g
28.223g
136%
Vitamin B5
0.864mg
4.03mg
63%
Vitamin B1
0.423mg
1.163mg
62%
Vitamin B6
0.417mg
1.17mg
58%
Copper
2.195mg
1.747mg
50%
Monounsaturated fat
23.797g
4.848g
47%
Selenium
19.9µg
36%
Folate
25µg
160µg
34%
Vitamin K
34.1µg
28%
Vitamin B2
0.058mg
0.415mg
27%
Iron
6.68mg
4.9mg
22%
Saturated fat
7.783g
3.682g
19%
Manganese
1.655mg
2.014mg
16%
Magnesium
292mg
353mg
15%
Fiber
3.3g
13%
Starch
23.49g
10%
Fats
43.85g
38.45g
8%
Vitamin B3
1.062mg
2.284mg
8%
Zinc
5.78mg
5.05mg
7%
Phosphorus
593mg
644mg
7%
Vitamin E
0.9mg
6%
Protein
18.22g
16.18g
4%
Calcium
37mg
78mg
4%
Calories
553kcal
517kcal
2%
Vitamin C
0.5mg
0mg
1%
Carbs
30.19g
34.29g
1%
Potassium
660mg
687mg
1%
Protein per 100 calories
3.3g
3.1g
N/A
Calories per 10 g protein
304kcal
320kcal
N/A
Weight per 100 calories
18g
19g
N/A
Unsaturated / Saturated Fat ratio
4.1
9
N/A
Net carbs
26.89g
34.29g
N/A
Sugar
5.91g
N/A
Sodium
12mg
3mg
0%
Vitamin A
0µg
3µg
0%
Tryptophan
0.287mg
0.183mg
0%
Threonine
0.688mg
0.586mg
0%
Isoleucine
0.789mg
0.717mg
0%
Leucine
1.472mg
1.154mg
0%
Lysine
0.928mg
0.534mg
0%
Methionine
0.362mg
0.284mg
0%
Phenylalanine
0.951mg
0.806mg
0%
Valine
1.094mg
1.025mg
0%
Histidine
0.456mg
0.452mg
0%
Fructose
0.05g
0%
Macronutrient Comparison
Macronutrient breakdown side-by-side comparison
2
18%
44%
30%
5%
3%
Protein:
18.22 g
Fats:
43.85 g
Carbs:
30.19 g
Water:
5.2 g
Other:
2.54 g
3
16%
38%
34%
6%
5%
Protein:
16.18 g
Fats:
38.45 g
Carbs:
34.29 g
Water:
5.62 g
Other:
5.46 g
Contains
more
Protein Protein
+12.6%
Contains
more
Fats Fats
+14%
Contains
more
Carbs Carbs
+13.6%
Contains
more
Other Other
+115%
Fat Type Comparison
Fat type breakdown side-by-side comparison
1
20%
60%
20%
Saturated fat:
Sat. Fat
7.783 g
Monounsaturated fat:
Mono. Fat
23.797 g
Polyunsaturated fat:
Poly. Fat
7.845 g
2
10%
13%
77%
Saturated fat:
Sat. Fat
3.682 g
Monounsaturated fat:
Mono. Fat
4.848 g
Polyunsaturated fat:
Poly. Fat
28.223 g
Contains
more
Mono. Fat Monounsaturated fat
+390.9%
Contains
less
Sat. Fat Saturated fat
-52.7%
Contains
more
Poly. Fat Polyunsaturated fat
+259.8%