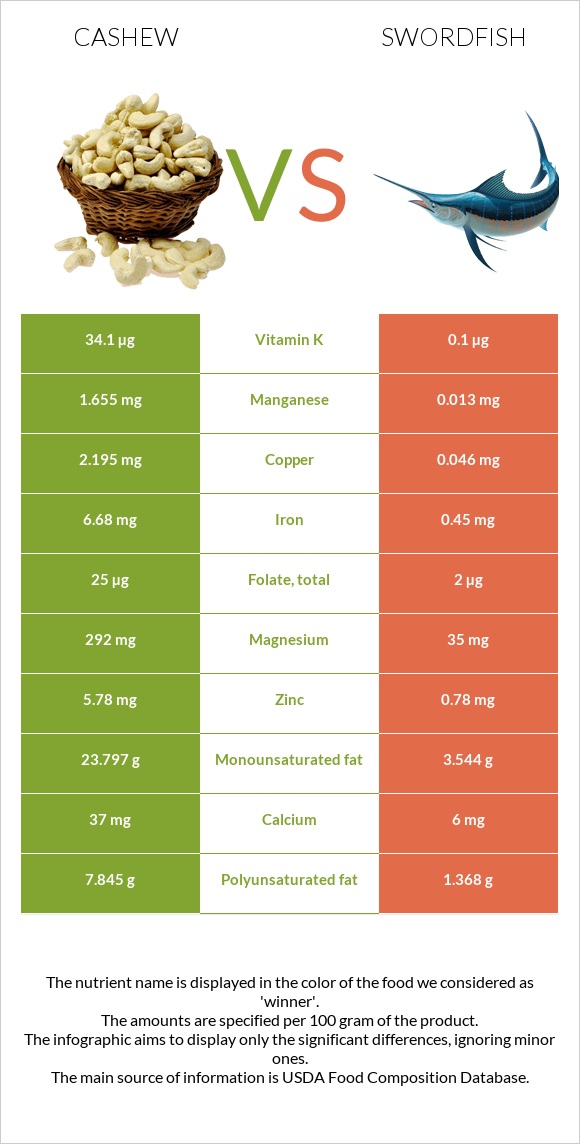
How are cashew and swordfish different? Cashew is richer in copper, iron, manganese, magnesium, zinc, and phosphorus, while swordfish is higher in selenium, vitamin D*, vitamin B12, and vitamin B3. Cashew covers your daily need for copper, 239% more than swordfish. Cashew contains 127 times more manganese than swordfish. Cashew contains 1.655mg of manganese, while swordfish contains 0.013mg. Cashew has a higher glycemic index (25) than swordfish (0). Nuts, cashew nuts, raw and Fish, swordfish, cooked, dry heat types were used in this article.
Infographic
Mineral Comparison
Mineral comparison score is based on the number of minerals by which one or the other food is richer. The "coverage" charts below show how much of the daily needs can be covered by 300 grams of the food.
9
100 g
300 g
1 oz - 28.35g
Magnesium
Magnesium
Calcium
Calcium
Potassium
Potassium
Iron
Iron
Copper
Copper
Zinc
Zinc
Phosphorus
Phosphorus
Sodium
Sodium
Manganese
Manganese
Selenium
Selenium
209%
11%
58%
251%
732%
158%
254%
1.6%
216%
109%
1
100 g
300 g
3 oz - 85g 1 piece - 106g
Magnesium
Magnesium
Calcium
Calcium
Potassium
Potassium
Iron
Iron
Copper
Copper
Zinc
Zinc
Phosphorus
Phosphorus
Sodium
Sodium
Manganese
Manganese
Selenium
Selenium
25%
1.8%
44%
17%
15%
21%
130%
13%
1.7%
374%
Vitamin Comparison
Vitamin comparison score is based on the number of vitamins by which one or the other food is richer. The "coverage" charts below show how much of the daily needs can be covered by 300 grams of the food.
5
100 g
300 g
1 oz - 28.35g
Vitamin C
Vit. C
Vitamin D
Vit. D
Vitamin A
Vit. A
Vitamin E
Vit. E
Vitamin B1
Vit. B1
Vitamin B2
Vit. B2
Vitamin B3
Vit. B3
Vitamin B5
Vit. B5
Vitamin B6
Vit. B6
Vitamin B12
Vit. B12
Vitamin K
Vit. K
Folate
Folate
1.7%
0%
0%
18%
106%
13%
20%
52%
96%
0%
85%
19%
6
100 g
300 g
3 oz - 85g 1 piece - 106g
Vitamin C
Vit. C
Vitamin D
Vit. D
Vitamin A
Vit. A
Vitamin E
Vit. E
Vitamin B1
Vit. B1
Vitamin B2
Vit. B2
Vitamin B3
Vit. B3
Vitamin B5
Vit. B5
Vitamin B6
Vit. B6
Vitamin B12
Vit. B12
Vitamin K
Vit. K
Folate
Folate
0%
249%
14%
48%
22%
15%
174%
25%
142%
203%
0.25%
1.5%
All nutrients comparison - raw data values
Nutrient
DV% diff.
Copper
2.195mg
0.046mg
239%
Selenium
19.9µg
68.5µg
88%
Vitamin D*
0 IU
666 IU
83%
Vitamin D
0µg
16.6µg
83%
Iron
6.68mg
0.45mg
78%
Manganese
1.655mg
0.013mg
71%
Vitamin B12
0µg
1.62µg
68%
Magnesium
292mg
35mg
61%
Fats
43.85g
7.93g
55%
Vitamin B3
1.062mg
9.254mg
51%
Monounsaturated fat
23.797g
3.544g
51%
Zinc
5.78mg
0.78mg
45%
Polyunsaturated fat
7.845g
1.368g
43%
Phosphorus
593mg
304mg
41%
Vitamin B1
0.423mg
0.089mg
28%
Vitamin K
34.1µg
0.1µg
28%
Saturated fat
7.783g
1.911g
27%
Cholesterol
0mg
78mg
26%
Calories
553kcal
172kcal
19%
Vitamin B6
0.417mg
0.615mg
15%
Choline
77.5mg
14%
Fiber
3.3g
0g
13%
Protein
18.22g
23.45g
10%
Carbs
30.19g
0g
10%
Starch
23.49g
10%
Vitamin E
0.9mg
2.41mg
10%
Vitamin B5
0.864mg
0.417mg
9%
Folate
25µg
2µg
6%
Potassium
660mg
499mg
5%
Vitamin A
0µg
43µg
5%
Sodium
12mg
97mg
4%
Calcium
37mg
6mg
3%
Vitamin C
0.5mg
0mg
1%
Protein per 100 calories
3.3g
14g
N/A
Calories per 10 g protein
304kcal
73kcal
N/A
Weight per 100 calories
18g
58g
N/A
Unsaturated / Saturated Fat ratio
4.1
2.6
N/A
Net carbs
26.89g
0g
N/A
Sugar
5.91g
0g
N/A
Vitamin B2
0.058mg
0.063mg
0%
Trans fat
0.056g
N/A
Tryptophan
0.287mg
0.265mg
0%
Threonine
0.688mg
1.035mg
0%
Isoleucine
0.789mg
1.088mg
0%
Leucine
1.472mg
1.919mg
0%
Lysine
0.928mg
2.168mg
0%
Methionine
0.362mg
0.699mg
0%
Phenylalanine
0.951mg
0.922mg
0%
Valine
1.094mg
1.216mg
0%
Histidine
0.456mg
0.695mg
0%
Fructose
0.05g
0%
Omega-3 - EPA
0g
0.127g
N/A
Omega-3 - DHA
0g
0.772g
N/A
Omega-3 - DPA
0g
0.168g
N/A
Omega-6 - Eicosadienoic acid
0g
0.022g
N/A
Macronutrient Comparison
Macronutrient breakdown side-by-side comparison
3
18%
44%
30%
5%
3%
Protein:
18.22 g
Fats:
43.85 g
Carbs:
30.19 g
Water:
5.2 g
Other:
2.54 g
2
23%
8%
68%
Protein:
23.45 g
Fats:
7.93 g
Carbs:
0 g
Water:
68.26 g
Other:
0.36 g
Contains
more
Fats Fats
+453%
Contains
more
Carbs Carbs
+∞%
Contains
more
Other Other
+605.6%
Contains
more
Protein Protein
+28.7%
Contains
more
Water Water
+1212.7%
Fat Type Comparison
Fat type breakdown side-by-side comparison
2
20%
60%
20%
Saturated fat:
Sat. Fat
7.783 g
Monounsaturated fat:
Mono. Fat
23.797 g
Polyunsaturated fat:
Poly. Fat
7.845 g
1
28%
52%
20%
Saturated fat:
Sat. Fat
1.911 g
Monounsaturated fat:
Mono. Fat
3.544 g
Polyunsaturated fat:
Poly. Fat
1.368 g
Contains
more
Mono. Fat Monounsaturated fat
+571.5%
Contains
more
Poly. Fat Polyunsaturated fat
+473.5%
Contains
less
Sat. Fat Saturated fat
-75.4%