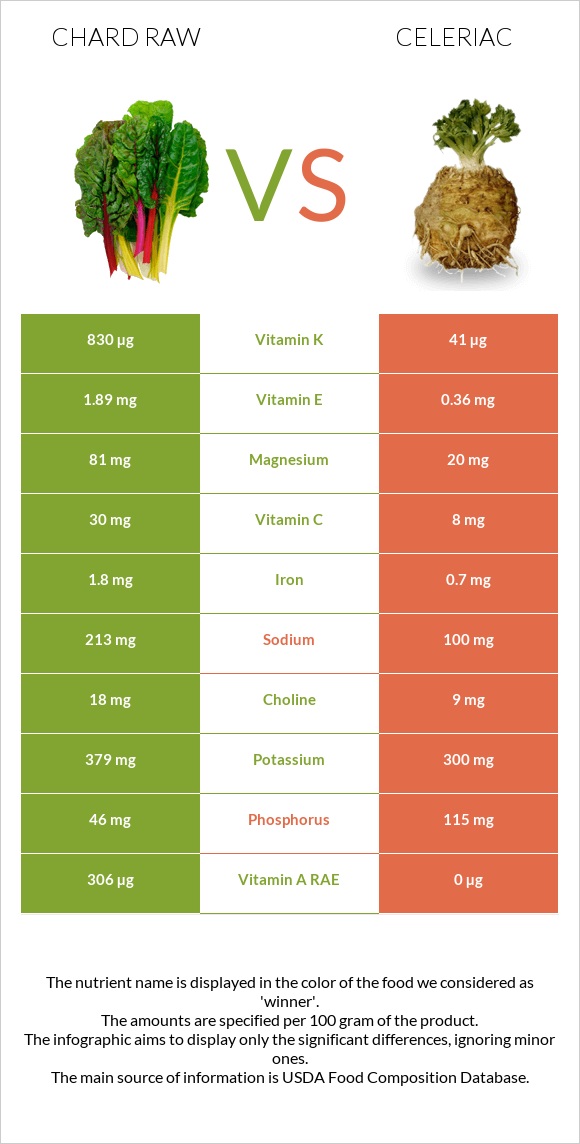
How are chard raw and celeriac different? Chard raw is richer in vitamin K, vitamin A, vitamin C, magnesium, iron, copper, vitamin E, and manganese, while celeriac is higher in phosphorus and vitamin B6. Chard raw covers your daily need for vitamin K, 658% more than celeriac. Chard, swiss, raw and Celeriac, raw types were used in this article.
Infographic
Mineral Comparison
Mineral comparison score is based on the number of minerals by which one or the other food is richer. The "coverage" charts below show how much of the daily needs can be covered by 300 grams of the food.
7
100 g
300 g
1 cup - 36g 1 leaf - 48g
Magnesium
Magnesium
Calcium
Calcium
Potassium
Potassium
Iron
Iron
Copper
Copper
Zinc
Zinc
Phosphorus
Phosphorus
Sodium
Sodium
Manganese
Manganese
Selenium
Selenium
58%
15%
33%
68%
60%
9.8%
20%
28%
48%
4.9%
2
100 g
300 g
1 cup - 156g
Magnesium
Magnesium
Calcium
Calcium
Potassium
Potassium
Iron
Iron
Copper
Copper
Zinc
Zinc
Phosphorus
Phosphorus
Sodium
Sodium
Manganese
Manganese
Selenium
Selenium
14%
13%
26%
26%
23%
9%
49%
13%
21%
3.8%
Vitamin Comparison
Vitamin comparison score is based on the number of vitamins by which one or the other food is richer. The "coverage" charts below show how much of the daily needs can be covered by 300 grams of the food.
6
100 g
300 g
1 cup - 36g 1 leaf - 48g
Vitamin C
Vit. C
Vitamin D
Vit. D
Vitamin A
Vit. A
Vitamin E
Vit. E
Vitamin B1
Vit. B1
Vitamin B2
Vit. B2
Vitamin B3
Vit. B3
Vitamin B5
Vit. B5
Vitamin B6
Vit. B6
Vitamin B12
Vit. B12
Vitamin K
Vit. K
Folate
Folate
100%
0%
102%
38%
10%
21%
7.5%
10%
23%
0%
2075%
11%
4
100 g
300 g
1 cup - 156g
Vitamin C
Vit. C
Vitamin D
Vit. D
Vitamin A
Vit. A
Vitamin E
Vit. E
Vitamin B1
Vit. B1
Vitamin B2
Vit. B2
Vitamin B3
Vit. B3
Vitamin B5
Vit. B5
Vitamin B6
Vit. B6
Vitamin B12
Vit. B12
Vitamin K
Vit. K
Folate
Folate
27%
0%
0%
7.2%
13%
14%
13%
21%
38%
0%
103%
6%
All nutrients comparison - raw data values
Nutrient
DV% diff.
Vitamin K
830µg
41µg
658%
Vitamin A
306µg
0µg
34%
Vitamin C
30mg
8mg
24%
Magnesium
81mg
20mg
15%
Iron
1.8mg
0.7mg
14%
Copper
0.179mg
0.07mg
12%
Phosphorus
46mg
115mg
10%
Vitamin E
1.89mg
0.36mg
10%
Manganese
0.366mg
0.158mg
9%
Sodium
213mg
100mg
5%
Vitamin B6
0.099mg
0.165mg
5%
Vitamin B5
0.172mg
0.352mg
4%
Carbs
3.74g
9.2g
2%
Potassium
379mg
300mg
2%
Vitamin B2
0.09mg
0.06mg
2%
Vitamin B3
0.4mg
0.7mg
2%
Folate
14µg
8µg
2%
Choline
18mg
9mg
2%
Calories
19kcal
42kcal
1%
Protein
1.8g
1.5g
1%
Calcium
51mg
43mg
1%
Fiber
1.6g
1.8g
1%
Vitamin B1
0.04mg
0.05mg
1%
Polyunsaturated fat
0.07g
0.148g
1%
Protein per 100 calories
9.5g
3.6g
N/A
Calories per 10 g protein
106kcal
280kcal
N/A
Weight per 100 calories
526g
238g
N/A
Fats
0.2g
0.3g
0%
Net carbs
2.14g
7.4g
N/A
Sugar
1.1g
1.6g
N/A
Zinc
0.36mg
0.33mg
0%
Selenium
0.9µg
0.7µg
0%
Saturated fat
0.03g
0.079g
0%
Monounsaturated fat
0.04g
0.058g
0%
Tryptophan
0.017mg
0%
Threonine
0.083mg
0%
Isoleucine
0.147mg
0%
Leucine
0.13mg
0%
Lysine
0.099mg
0%
Methionine
0.019mg
0%
Phenylalanine
0.11mg
0%
Valine
0.11mg
0%
Histidine
0.036mg
0%
Macronutrient Comparison
Macronutrient breakdown side-by-side comparison
3
2%
4%
93%
Protein:
1.8 g
Fats:
0.2 g
Carbs:
3.74 g
Water:
92.66 g
Other:
1.6 g
2
9%
88%
Protein:
1.5 g
Fats:
0.3 g
Carbs:
9.2 g
Water:
88 g
Other:
1 g
Contains
more
Protein Protein
+20%
Contains
more
Other Other
+60%
Contains
more
Fats Fats
+50%
Contains
more
Carbs Carbs
+146%
Fat Type Comparison
Fat type breakdown side-by-side comparison
1
21%
29%
50%
Saturated fat:
Sat. Fat
0.03 g
Monounsaturated fat:
Mono. Fat
0.04 g
Polyunsaturated fat:
Poly. Fat
0.07 g
2
28%
20%
52%
Saturated fat:
Sat. Fat
0.079 g
Monounsaturated fat:
Mono. Fat
0.058 g
Polyunsaturated fat:
Poly. Fat
0.148 g
Contains
less
Sat. Fat Saturated fat
-62%
Contains
more
Mono. Fat Monounsaturated fat
+45%
Contains
more
Poly. Fat Polyunsaturated fat
+111.4%